


How many people would actually use a Sydney-Canberra fast train? This post looks at a variety of sources to answer that question.
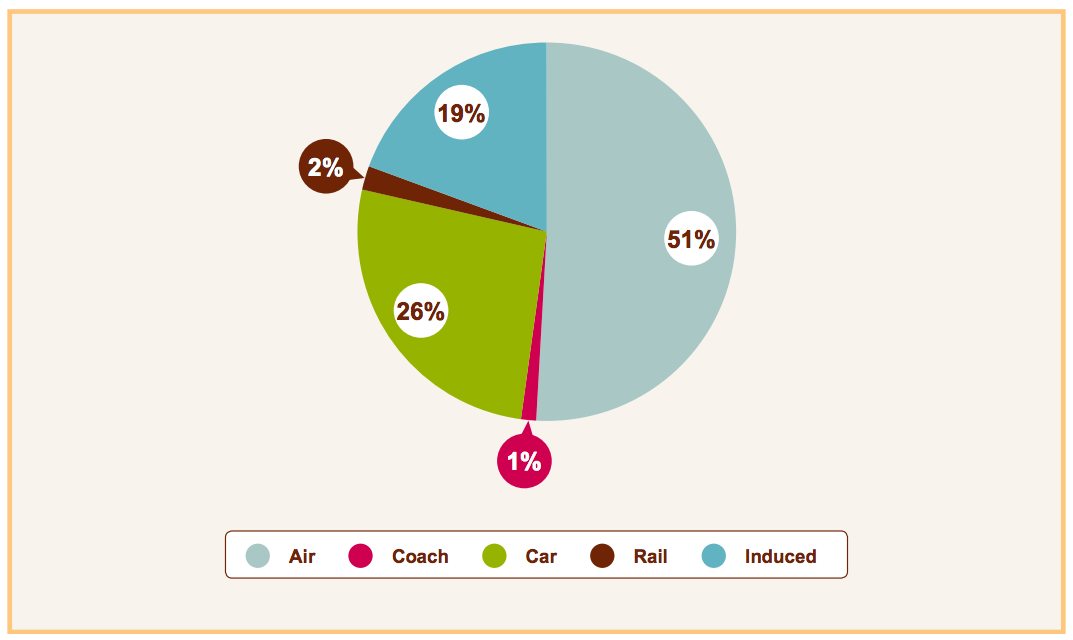
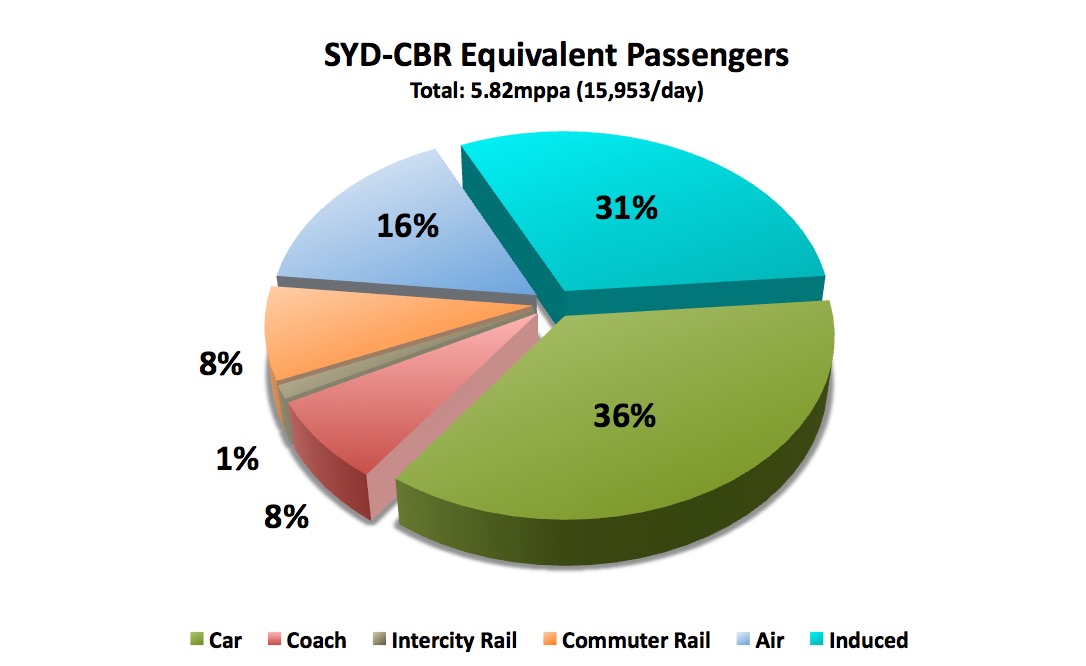
Executive summary: Total passenger demand would be 10.68 million passengers per annum (mppa), or 29,273/day. Of these, 26% would be between Sydney and Canberra, 17% from the Goulburn region (“Capital Country”), 32% from the Southern Highlands region, and 23% from the Sydney fringe. Weighted according to length of trip, the numbers can be adjusted to 5.82mppa Sydney-Canberra equivalent (15,953/day).
Cars are the largest source of demand, accounting for 36% of demand and taking 5,800 cars off the road each day. Next is induced demand at 31%, with almost 7,200 new commuters moving to towns in the Southern Highlands, Goulburn and the Capital region. Air travel is next, it’s 16% share representing 100% of current airline demand (ie, scheduled airline service between Sydney and Canberra would cease to be competitive and be discontinued). Passengers switching from conventional rail services represent 9% of demand, and coach services represent 8%.
These absolute passenger numbers are for 2015 demand levels, yet are still substantially higher than the 2065 prediction of the AECOM study (by which time Australia’s population is predicted to have grown by 50% and travel in the east coast corridor doubled). This is due to Hot Rails having a much larger number of regional stations than the proposed AECOM service and therefore the ability to capture a greater share of the commuter and regional market.
AECOM projections
The 2013 AECOM study has already done a lot of the work here, so we can both use their data and compare our own results to theirs. By 2065 AECOM predicts an east coast high speed railway would transport 83.6 million passengers per annum (Ch2 pp25), or 229,000 trips per day. On the Sydney-Canberra route, their prediction is 8.44mppa (23,123/day) in total, split between 5.19 mppa (14,219/day) between Sydney and Canberra, and 3.25mppa (8904/day) between intermediate destinations. This refers to absolute ridership numbers, rather than weighted according to the length of the trip.
2035 prediction of East Coast HSR travel demand source. From AECOM13 Ch.2
They’ve also got data about present passenger numbers, which is what we’re interested in; the following is AECOM’s estimate of passenger numbers (per day) for all modes on the Sydney-Canberra corridor in 2009 (ch2 pp66, modified from a modeshare percentage matrix):
[table]
Destination pair,TOTAL pax/day,Air,Car,Coach,Rail
Sydney-Canberra,12712,1525,9916,1271,127
Regional-Sydney,65425,0,56919,1963,6542
Regional-Canberra,6849,68,6575,137,68
Regional-Regional,7232,0,6944,145,145
TOTAL,92219,1594,80354,3516,6883
[/table]
Sources of demand
There are only five places that a very fast train can get its customers from. They are cars, buses, standard rail, air, and so-called “induced” demand. The first four are relatively simple to estimate: there is a known existing level of demand for that service, and we make an informed assumption about what share of those users will switch to fast rail. The matter of induced demand however is more complex; we must necessarily make some assumptions about future consumer behaviour based on imperfect knowledge. However even there we are able to get reasonable ballpark numbers. We shall analyse each of the five sources of demand in turn.
Car
Car transportation is different to coach, rail or air travel in that it is not restricted to any particular start or end points: users typically use the car for the entirety of the journey from home to destination. Additionally, the car has the advantage of being available for further use after the destination is reached. For example, a train would probably gain a high market share to a ski resort where a car would not be used during the visit, but a low market share to a food-and-wine district where driving to many different locations is part of the appeal. Therefore, HSR does not typically capture a large percentage of the car market; AECOM13 predicts that HSR would change the car modeshare for Sydney-Canberra trips from 65% to 53% (Ch2, pp85). In other words, HSR could capture perhaps 18-20% of existing car passengers.
So how many car passengers are there? A number-plate survey by AECOM13 estimates that in 2009 there were 2,639,000 vehicle movements between Canberra and Sydney (ch2 pp70), which is an average of 7230 vehicles per day in both directions. Current traffic data from the RMS Traffic Volume Viewer shows that there were 13,916 vehicle movements on the Federal Highway just south of the junction with the Hume in 2015. This is up from 11,944 in 2009, so comparing with the AECOM data indicates that 60.5% of cars on the Federal Highway are going all the way from Sydney to Canberra or vice-versa.
Assuming the share going all the way from Sydney to Canberra has remained constant at 60.5%, that means in 2015 there were 8,424 cars going between Sydney and Canberra, and 5,492 between Canberra and somewhere else. Assuming a typical occupancy rate of 1.6 people per vehicle (the national average), this comes out to 13,478 passengers between Canberra and Sydney, and 8,787 between Canberra and an intermediate destination. We will conservatively assume that two thirds of the intermediate destinations will be accessible to the fast railway, giving a total potential market of 5,888 passengers.
But what about between intermediate destinations and Sydney? Well now we’re talking a big market. The Traffic Volume Viewer for the Hume Highway at Wilton shows 36,824 vehicles per day (note: this is substantially lower than the AECOM estimate at the start, which may be due to AECOM including access routes into Sydney other than the Hume Highway). Subtract 8,424 for the cars going between Sydney and Canberra, and perhaps another 7,500 for those going between Sydney and somewhere else (traffic volume on the Hume west of the Federal Hwy was 8,949/day; let’s assume most of those were coming/going to Sydney) and we still end up with an enormous 20,900 vehicles per day. Many of those will of course be freight movements, and some will be going to destinations other than Sydney itself, so let’s be conservative and assume that the car market for intermediate destinations to and from Sydney is 15,000 per day, representing 24,000 passengers.
There’s also a decent amount of commuter traffic between Bungendore and Canberra, which is not on the Hume Highway corridor but is on the proposed Hot Rails route. The King’s Highway west of Bungendore sees 3888 cars each day; we’ll take a blatant guess and say that 75% of those vehicles are commuting to Canberra, meaning there would be 1458 commuting vehicles per day. According to the 2011 census, the workforce in Bungendore is 2344 people, and according to a recent local newspaper article, about two thirds of those work in Canberra; if true then that would make 1570 commuters, which agrees very closely with our estimate based on traffic count. We will assume 1570 commuters, which means 3140 trips per day.
So the potential market for car passengers on the Sydney-Intermediate-Canberra route is as follows:
[table]
Destination pair,Vehicles/day,Passengers per day,mppa
Sydney-Canberra,8424,13478,4.92
Intermediate-Canberra,5491,5887,2.15
Intermediate-Sydney,15000,24000,8.76
Bungendore-Canberra,1962,3140,1.15
TOTAL,29066,46505,16.97
[/table]
If we take the AECOM assumption that HSR would capture 20% of the car modeshare, that is 9,301 passengers/day (both directions). Assigning a weighting of 50% to the intermediate trips (and 15% for Bungendore) to take account of their shorter distance reduces this number to 5,779.
Bus/Coach
Sydney metropolitan buses do not service any regional areas, and the intra-regional bus services are very small scale. Thus, we are left with the two major intercity coach providers, Murray’s and Greyhound.
Greyhound offers 12 daily services in each direction, and Murray’s offers 17, for a total of 58 bus services between the cities daily. Standard coaches are licensed for 40 passengers, so that’s 2320 seats available daily. I’ve no idea what their average passenger load factor is; let’s assume a reasonably good load factor of 75% (although I have personally found that they are often booked out if not booked in advance). That would mean coaches currently transport 1740 people between the capitals.
AECOM offers similar numbers, suggesting 1271 passengers between Sydney and Canberra, but also 2244 passengers to an intermediate destination. We will use these numbers numbers in lieu of the rough guesstimate above.
Coach and bus services can be considered a direct competitor to current rail services, offering a similar service in terms of frequency and pickup/dropoff locations, and a similar speed to self-driving. High-speed rail would undoubtedly be a far superior service to a bus or coach due to its higher speed, and thus it is tempting to conclude that HSR would capture 100% of the coach market. However, at $39 for a one-way SYD-CBR fare, the coach is a low-priced option that will quite likely remain attractive for price-sensitive travellers who merely want the cheapest service (eg, backpackers).
Let’s take a stab in the dark and assume HSR would capture 50% of the coach market – that would mean 636 Sydney-Canberra trips, and 1122 intermediate trips. Applying a trip-length weighting of 50% to the intermediate trips modifies this to 543 intermediate trips, for a total weighted ridership of 1179 attributable to demand captured from coaches.
Standard Rail
This can really be broken down into two subsections: intercity rail and commuter rail (currently serviced by NSW Trainlink and Sydney Trains respectively).
Intercity rail is an easy estimation. We are directly replacing the service, so we’ll get 100% of the existing passengers. AECOM estimated the numbers at a paltry 55,000 passengers per annum (150 per day) in 2009. My initial reaction is: Surely that can’t be right? I am a regular on that train. There’s 6 services per day (3 in each direction), it’s typically a 3- or 4-car trainset with each car having 60 seats, which means there are about 1260 seats offered daily, which makes the train’s load factor barely 12%. And yet, he thinks….. there’s almost always one completely empty car, the economy car might be 75% full and the first class car 40%…. and the First Class car only has 40 seats anyway…. that makes more like 360 people per day. Data direct from NSW Trainlink passenger statistics gives the numbers for 2013 as 46,900 SYD-CBR and 40,000 CBR-SYD, for a total of 238 passengers/day. Whatever. It’s a rounding error. Barely worth wasting the time to calculate. We will round the NSW stats up to 240 people per day. #science
Commuter rail is a different kettle of fish. There are a bunch of different services going to different places with different capacities, but there are really only three services that are relevant: Goulburn-Campbelltown, Moss Vale-Campbelltown (which together make up the Southern Highlands Line) and the Campbelltown-Central limited-stops service. The passenger stats that follow are from BTS Train Statistics 2014, the schedule frequency is from the Sydney Trains timetable, and I had to guess the load factor for Campbelltown-Central trains; I went for something pretty low (25%) since we are only really interested in the people who go all the way to the outer suburbs. We also assume how much of the standard rail market HSR will be able to capture; we have assumed that under a Hot Rails scenario the Goulburn service would be discontinued entirely and only fast rail offered, so that is 100% capture. For the shorter journeys, it is conceivable that some patrons would prefer the cheaper but slower option; we have conservatively assumed that HSR would capture 80% of the existing ridership from Moss Vale, and 25% from Campbelltown.
[table]
Service,Trains/day (both directions),Seats/train,Seats/day,Pax/day,HSR share,HSR Pax
Goulburn-Campbelltown,8,180,1440,508,100%,508
Moss Vale-Campbelltown,38,180,6840,2415,80%,1932
Campbelltown-Central (limited stops),50,400,20000,5000 (guess),25%,1250
TOTAL,96,,28280,7922,,3689
[/table]
Although these are quite impressive numbers, they are all intermediate journeys of substantially shorter length than the full trip. Assigning weights based on the percentage of the total distance to Canberra (Goulburn 60%, Moss Vale 40% and Campbelltown 20%), this results in a modified estimate of 1328 SYD-CBR equivalent trips
Air
AECOM used a model developed by Peter Jorritsma to estimate the percentage of an airline route’s patronage that a high-speed railway would capture. Under the Jorritsma model, HSR’s market capture is a function of rail travel time only. Where t is travel time in minutes, market share is 1/(0.031*1.016^t+1), which is graphed below. This model predicts that high-speed railways are highly competitive for routes under 3 hours in duration, but that there is very little demand for trips over 6 hours. The model matches actual HSR market share in many European city pairs remarkably well (see eg, AECOM13, ch1 pp13, image available at Crikey). The Sydney-Canberra high-speed railway, which under the Hot Rails plan would have a 91 minute travel time, could expect to capture about 88% of air’s market under this model. In practice, it is far more likely that Qantas and Virgin would discontinue scheduled services between Sydney and Canberra, as has been seen between many european city pairs where the rail travel time is under two hours. So in actual fact we will assume a 100% market share of air.
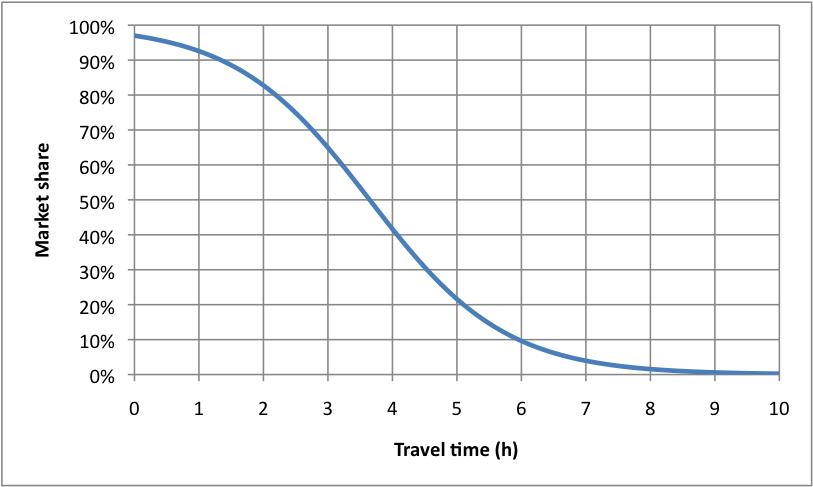
Jorritsma model of HSR market share.
BITRE estimates 946,000 passengers flying between Sydney and Canberra annually, which comes out to 2592 passengers per day.
Induced
Now this is the tricky bit where you really have to do some handwaving. Induced demand are additional trips that are taken as a direct result of the provision of the new service. They’re not taken from any existing service. It is generally assumed that the majority of such induced demand will be as a result of property developments being built in newly-accessible regional centres, thus increasing commuter travel as well as general and leisure use of the line.
AECOM assumed that induced demand would add up to 20% of total demand. This figure is lower than what one would expect for Hot Rails, as the focus of AECOM was on capturing air travel passengers, rather than the explicit focus on regional development that Hot Rails has. When you consider that Hot Rails stops at 15 regional stations, fairly impressive numbers of induced demand become possible. The following table lists the stations that will be served by the fast train, and compares the performance of the existing service (commuter numbers from the Bureau of Transport Statistics again).
[table]
Station,Distance from Sydney (km),Existing travel time (min),Hot Rails travel time (min),Daily turnstile count (rail to Sydney)
Sydney,0,0,0,N/A
Glenfield,35,36,11.9,4740
Campbelltown,48,50,18.7,6060
Wilton,70,79,28.3,50
Bargo,86,104,36,80
Yerrinbool,90,115,41.3,30
Mittagong,104,101,35.7,160
Bowral,110,105,37.2,260
Moss Vale,119,112,40,250
Bundanoon,133,131,44.3,30
Penrose,142,138,67.8,0
Wingello,147,143,48.4,0
Marulan,162,156,52.9,10
Goulburn,190,176,64.3,70
Lake Bathurst,219,185,76.2,0
Tarago,228,190,81.5,0
Bungendore,256,210,93.2,0
Canberra,294,246,90.6,120
[/table]
Let’s consider these numbers. Look at the major towns of the Southern Highlands: 670 people make the daily trip from Mittagong, Bowral and Moss Vale, despite a travel time of almost two hours. 70 brave souls make the trip all the way from Goulburn, just shy of 3 hours away! Meanwhile, over 6000 commuters pass through the turnstiles at Campbelltown daily. The limited-stops service from Campbelltown takes 50 minutes to get to Central, while regular service takes about a quarter-hour longer.
Now look at the Hot Rails travel times. The entire Southern Highlands is within 40 minutes of Central on the limited-stops service, comparable to the existing travel time from Glenfield. Goulburn is 64 minutes away, comparable to the existing travel time from Campbelltown. Canberra is 90 minutes away express, or 15 minutes more on the limited-stops run, comparable to the existing travel time from Bargo or the Southern Highlands. Conclusion: There should be significant induced demand for a regional fast railway.
The following graph is a conservative projection of the probable induced demand at each station to be served by Hot Rails. These numbers are based on the observed existing commuter numbers from stations with comparable slow-rail travel times. There is necessarily a bit of guesswork involved here, based on the nature of each location and its existing or potential housing stock.
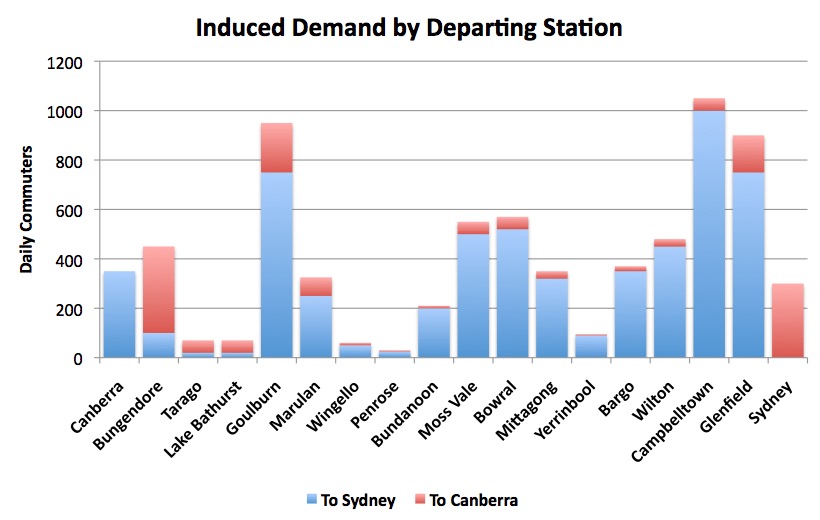
Some discussion: Goulburn is envisaged to become a major dormitory town for Sydney commuters due to its large existing and potential housing stock. The larger Southern Highlands towns likewise are expected to see vastly increased commuter numbers; our numbers project a tripling of existing commuter demand (meaning an induced demand of double the existing numbers). Wilton and Bargo stations, though having only minor existing demand, are projected to not only increase their own demand but capture additional demand from other Wollondilly Shire commuters (current demand 260 from Picton and 200 from Tahmoor), whose stations are bypassed by the new line. Smaller towns along the line (eg Wingello, Penrose, Yerrinbool) have relatively low projected demand due to their limited existing housing stock, and uncertainty over future development approvals. However, these stations would still be able to function as park-and-ride stations for people in the broader area, perhaps living on hobby farms or semi-rural areas. A major wild card in this author’s opinion is the small township of Marulan, located smack on the Hume Highway and with substantial potential development, but presently too far from Sydney to see a major influx of population. You heard it here first; Marulan could be Australia’s first city created by HSR.
In all cases the projected demand is substantially lower than the observed demand at stations with similar existing commute time. This is reflective of the fact that the proposed HSR service will be at a higher price point than the existing CityRail service, yet the projected numbers are still a conservative estimate. It would be expected that induced demand would increase over time as a greater number of property developments were undertaken.
In total, we project that 7,180 new commuters would utilise the service twice every weekday. Adjusting for reduced demand on weekends (assumed to equal 35% of weekday demand), this results in an average of 11,693 induced passengers per day, or 4,884 SYD-CBR equivalent.
Results
Sources of HSR demand, (2015 levels)
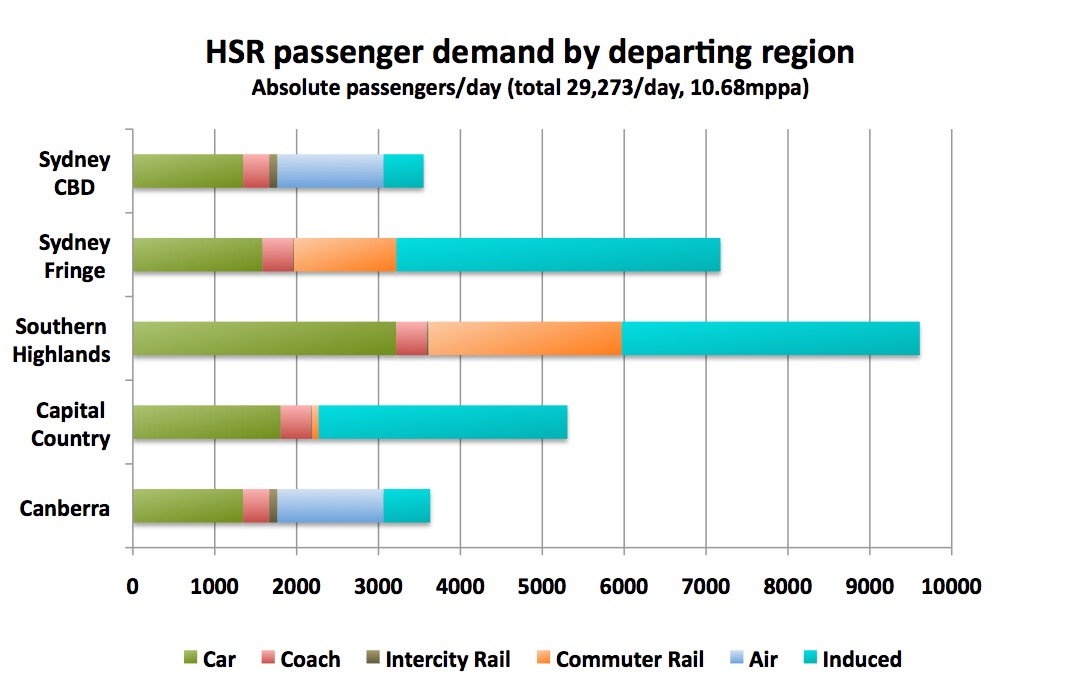
Source of passenger demand according to home station location (absolute numbers)
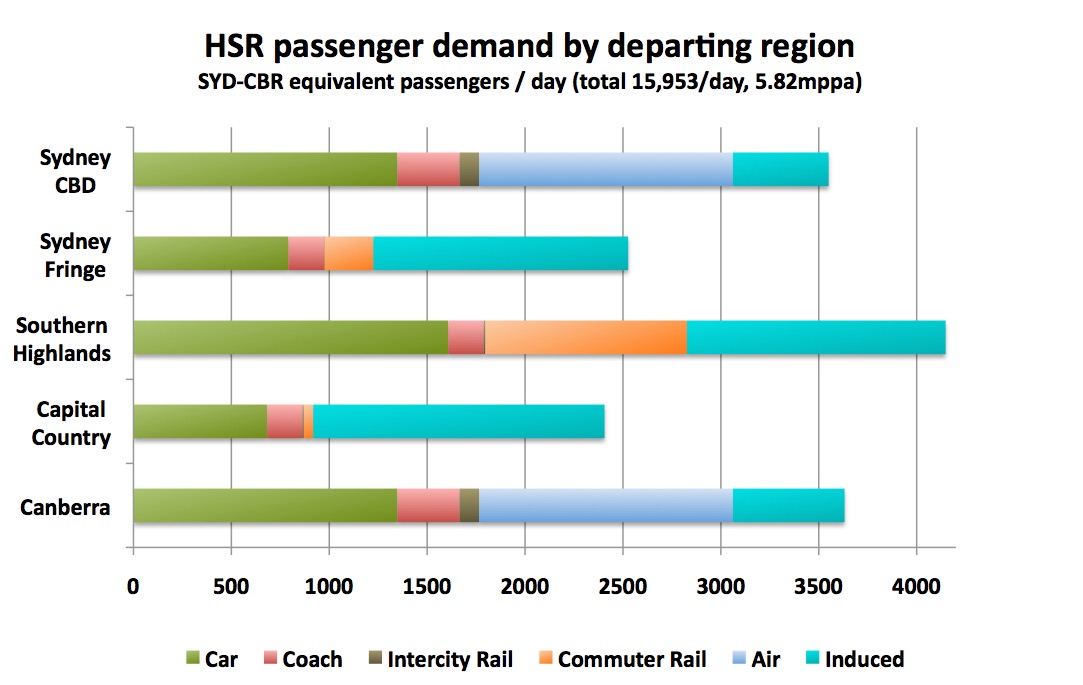
Source of passenger demand according to home station location (weighted according to length of trip)
Our results show a substantial difference to the demand projections in the 2013 AECOM study. The absolute passenger numbers using 2015 demand data are far greater than AECOM’s projections for 2065 (29,273 versus 23,123 passengers per day). Accounting for the projected increase in population and travel frequency between now and 2065, Hot Rails probably has well over double the demand forecast of AECOM’s faster service. How can this be?
It all comes down to the number and location of stations. AECOM’s proposed railway would have just two regional stations, both of them seemingly sited to minimise convenience: one is at Holsworthy (a military base about 2km from Glenfield – it’s actually in the bush), and the other at Mittagong Airport (on the far side of the airport from town – again, in the fricking bush). Neither of these locations are convenient to townships or other modes of transport. As such, AECOM’s ridership is overwhelmingly capital to capital, and is drawn mostly from air and car. Relatively few trips are diverted from conventional rail, or induced. Indeed, how could there be when there aren’t actually any stations to get on at? Live in Goulburn and want to use AECOM’s VFT? Tough, you’re mid-way between Canberra and Mittagong, both of which are an hour’s drive away. No wonder their passenger models predict low utilisation.
In contrast, the proposed Hot Rails service would stop at 16 regional stations with a variety of stopping patterns to cater for different user preferences. Almost the entire population of the Southern Highlands and Capital Country would be within a 15 minute drive of a station; most would be closer or even able to walk. It would capture huge market share from the existing rail service to Sydney’s fringe, and create entirely new commuting zones far beyond the city limits. It would in fact bring far greater benefit to the average Sydneysider, Canberran or Highlander than the super-fast, but rarely stopping AECOM proposal.
It is a common misconception in this country that inter-capital high speed rail can be successful in isolation. In actual fact, most overseas networks (particularly in Europe) were built as trunk-lines for a much larger network of feeder lines. The TGV serves not only Paris to Lyon, but has transformed rail transportation all over France, even to destinations that are served only by conventional rail. High Speed Rail To The Node is in fact the right and proper and indeed the only way to do it successfully, and the comparison between AECOM’s projected demand and Hot Rails’ shows why.