


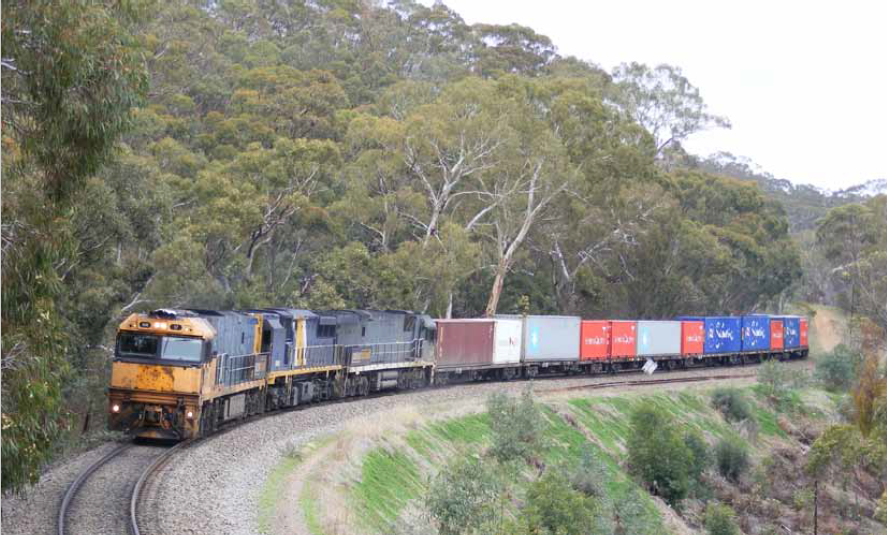
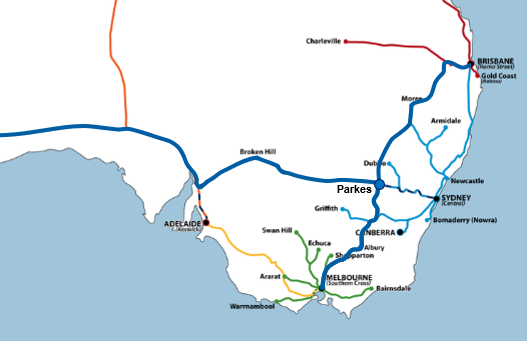
The Adelaide Hills isn’t usually thought of as one of Australia’s most important rail corridors. Traffic isn’t particularly heavy; there are only 52 scheduled train movements per week – most of them intermodal, plus a handful of regular steel trains. It carries no heavy bulk mining products, and only small amounts of seasonal grain. To judge by the trains going by, it doesn’t look like a big part of the market.
But looks can be deceiving. Freight task isn’t measured in tons, but rather in ton-kilometres, and the trains that use this railway cover a lot of kilometres. Two thirds of the trains – 35 every week – cover the full 3,500 kilometres between Melbourne and Perth, with the remainder doing the 800-kilometre Adelaide-Melbourne run. All told, over 18 billion gross-ton-kilometres of rail freight task moves through the Adelaide Hills, representing 27% of the non-coal freight task on the interstate network, and almost 40% of the intermodal task. The importance of the Adelaide Hills railway is felt across the continent – it is, in fact, one of the most vital links in our entire freight network. And it’s in desperate need of a major modernisation.
Thirteen years ago today, any hope for such an upgrade was extinguished by the Adelaide Rail Freight Movements Study, which delivered a disablingly bleak cost-benefit analysis of the proposal. But this negative verdict was, in large part, a result of the very misconception outlined above. A revised examination of the study, employing an appropriately-scoped economic analysis, makes it unequivocally clear: the Adelaide Hills rail upgrade must promptly secure its place among the top priorities in our national infrastructure.
We find that the 2010 Adelaide Rail Freight Movements Study significantly undervalued the economic benefits of the proposal, owing primarily to three errors in scope:
- The study area was defined too narrowly;
- Near-term modal shift was ignored;
- The evaluation period was improperly short.
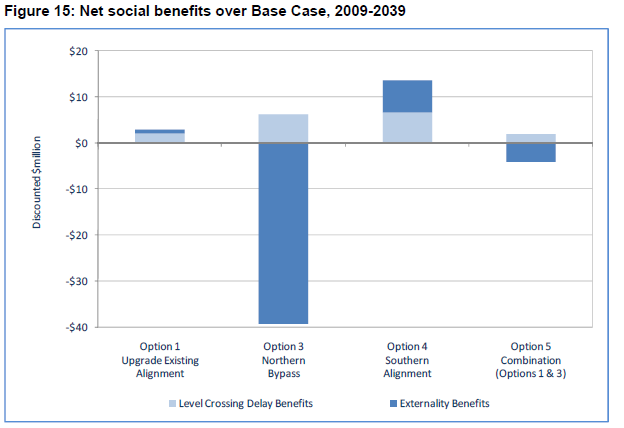
Our re-evaluation gives a starkly different result to the 2010 report. All three of the options considered demonstrate significant net economic benefits, most significantly:
- Enabling double-stacking results in operating cost savings of some 25% to existing rail customers, amounting to over $90m per annum;
- Road-to-rail modal shift of up to 3.0mtpa removes 130,000 trucks from the road annually, resulting in operating cost savings of $100m/annum, plus $30m/annum in enviro-social benefits.
Over 50 years, the Southern (Mount Bold) option offers the highest benefits relative to the base case, with a Net Present Value of $2.64 billion, whereas the Upgrade Existing option displays the highest Benefit-Cost Ratio, at 5.2; it also proved the most resilient to sensitivity testing. The Northern (Truro) option, though still net-positive, delivers substantially lower net benefits compared to the other options. However, it also offers key strategic points of difference, namely, removal of freight from suburban Adelaide, and the potential redevelopment of inner-city freight precincts for urban renewal.
Consequently, this review advocates substantial investment in the Adelaide Hills corridor. The proposal warrants advancement to a full feasibility study overseen by Infrastructure Australia, which would refine the engineering and economic case, aiming to commence the delivery phase by the end of this decade.
Background
The Adelaide Rail Freight Movements Study (ARFMS) was announced by then-Transport Minister Anthony Albanese on 3 September 2008, in fulfilment of an election commitment by the federal Labor government under Prime Minister Kevin Rudd. The global engineering and professional services consultancy GHD was awarded the contract in late 2008, and the study commenced in January 2009. It cost a reported $3 million and took 18 months to complete, being released on June 24, 2010. The full study, including the many public submissions received, appears to no longer be on the Department of Infrastructure’s website, but it can still be accessed using the Wayback Machine, here.
The study’s main objective was to design and evaluate the economic viability of a double-stacked rail freight route through or around the Adelaide Hills, in order to eliminate one of the last remaining bottlenecks between Melbourne and Perth; a secondary goal was to alleviate impacts on residential areas traversed by the existing line. To this end, several potential bypass alignments were designed and costed, as well as a minimalist upgrade to the existing alignment. They also estimated future freight demand along the corridor, performed a community and stakeholder consultation, and an analysis of future economic benefits as a result of each upgrade option.
The economic analysis found that none of the proposed upgrade options returned a positive net present value – in fact, none of them came anywhere close. The project was branded a white elephant, and that finding has been almost universally accepted in the years since.
| OPTIONS | Upgrade Existing | Truro Route | Mount Bold |
| Cost (undiscounted) | $700m | $2,400m | $3,000m |
| Cost (present value) | $568m | $1,710m | $2,009m |
| Benefits (present value) | $98m | $77m | $204m |
| Net Present Value | -$470m | -$1,633m | -$1,805m |
| Benefit-Cost Ratio | 0.173 | 0.045 | 0.102 |
In the aftermath of the study’s release, much of the opposition to its findings was from Mitcham and Adelaide Hills residents whose primary concern was noise pollution. In consequence, there developed a perception that the bypass proposal was mainly for the benefit of a small number of relatively wealthy residents, rather than being an infrastructure project of national significance. The study’s claims of minimal above-rail operating benefits went largely unchallenged.
Subsequent work by Northlink Reference Group (2010), Tonkin (2018) and GlobeLink (2019) focused on the Truro route, despite having both the lowest total benefits and lowest BCR according to the ARFMS analysis. Their preference is apparently motivated by a strategic imperative to remove freight from suburban Adelaide entirely – for urban amenity purposes in the case of Northlink/Tonkin, and in the case of GlobeLink, to support the proposed intermodal super-hub at Monarto. The main criticisms of the ARFMS centered upon a supposed failure to sufficiently consider vaguely-defined “wider economic benefits”, rather than on the core issues of operating costs and modal shift.
Despite the negative findings, there has since been some partial progress towards upgrading the existing alignment: both Goodwood and Torrens Junctions have been grade-separated from the suburban network, and the Callington and Ambleside Loops have been extended to accommodate 1800m trains. Encouragingly, it’s even made it onto the Infrastructure Australia priority list. But there is still no serious prospect of a major realignment or bypass. The ARFMS is frequently cited as evidence that any significant enhancements to the Adelaide Hills rail corridor are untenable.
However, South Australia now finds herself in a difficult position, with interstate freight overwhelmingly dependent on trucks, a congested and dangerous road gateway to the city, and no clear solution in sight. Multi-billion dollar truck bypasses are being seriously proposed, with costs and environmental impacts far exceeding anything contemplated for a rail bypass. Furthermore, with the ongoing debate over the future of freight and passenger rail in the Adelaide Hills, and the potential for Inland Rail to drive significant reductions in freight traffic in the Adelaide region (and the associated economic losses to the state), it is vitally important that the ARFMS and its conclusions are subject to appropriate scrutiny.
Engineering and alignment selection
Route description
The study outlined five feasible options, as described below:
“Upgrade Existing” involved no change to the alignment curvature or gradient, but proposed modifications to structures, tunnels and loops to allow double-stacking clearance, and to increase train length from 1500m to 1800m. Noise walls, pedestrian overpasses and level crossing upgrades were also included. Additionally, major grade separations were proposed for rail crossings at Torrens Junction and Goodwood Junction, as well as the level crossings at Cross Road, Main Road (Blackwood) and Main Road (Glenalta).
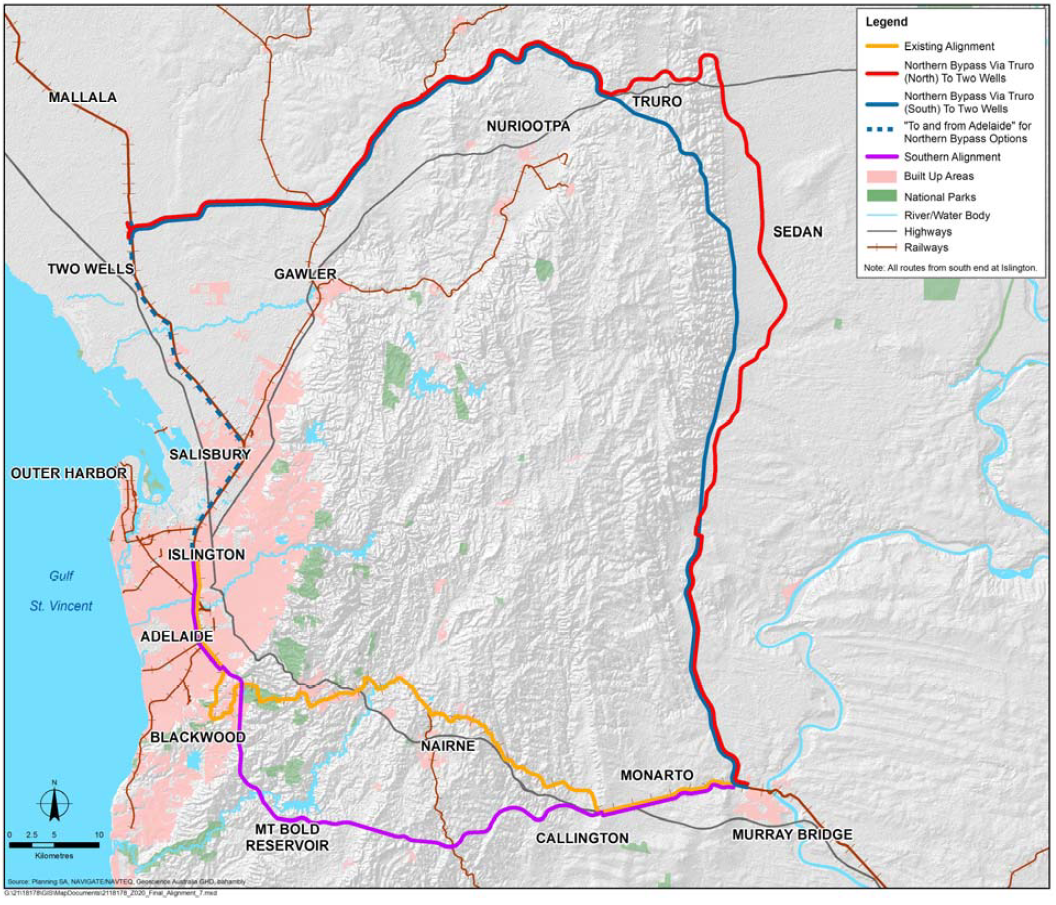
The two northern “Truro” routes bypass Adelaide entirely, generally following the closed Sedan Railway along the plains east of the Hills, before climbing the eastern Mount Lofty range. The northern route utilises the existing railway until Sedan, while the southern route departs the existing corridor earlier, at Sanderston, thus resulting in a shorter overall route. Both options require significant lengths of tunnel and bridge, reach their summit near Truro, then descend on a constant 1% gradient through the northern Barossa Valley (partially using the Kapunda line), then ease to a sub-0.5% descent at Roseworthy, before rejoining the existing, flat Adelaide to Crystal Brook railway between Two Wells and Mallala.
The southern “Mount Bold” route is substantially more challenging from an engineering perspective, requiring extensive tunneling and bridge infrastructure. It departs from the existing route around Callington, climbing at a 1% gradient through hilly country between Wistow and Macclesfield to a summit at the Green Hills Range near Flaxley, roughly midway between Meadows and Echunga. Descending at a constant 1% gradient via Kangarilla to the south of Mount Bold Reservoir, it enters a very long, 15-km tunnel near Clarendon, emerging in Metropolitan Adelaide and rejoining the existing corridor near Mitcham. We note that the proportion of new alignment comprising bridges or tunnels is unusually high, at almost 80% of its length.
Finally, the study also evaluated a combined upgrade and bypass of the existing railway using the Truro (south) option, aiming to provide maximum benefit to Melbourne-Perth freight while not disadvantaging Adelaide freight. This option had both the highest construction cost and lowest net present value and BCR of any option.
While the study includes a detailed table of engineering quantities for each option, this is not true of the cost estimates, making it difficult to review the estimate for credibility. The roundness of the final capital cost figures (estimated to only two significant figures, i.e., to the nearest hundred million dollars) suggests that only a high-level estimation was undertaken. Nevertheless, the final costs per kilometre of the proposed alignments ($15.5m/km to $50m/km) seem reasonable enough – adjusted for inflation, the range is comparable to the more mountainous sections of Inland Rail.
While the construction period is not explicitly stated, we can infer it for each option using the discounted capital costs given on page 34, and the discount rate of 7%. The assumed construction periods are unusually long, ranging from 5 years for the Upgrade option, to 12 years for Mount Bold. This extended construction timeline, by delaying the benefits of the project and therefore discounting their value, has a severely adverse effect on the project’s apparent viability. Halving construction time would be a reasonable and still conservative value, in line with contemporary examples. “Upgrade existing” should compare to a project like Torrens Junction or the Toowoomba Range Clearance Upgrade (both of which took under 2 years), while either of the bypass options would compare to Inland Rail Gowrie-Kagaru (predicted to take 3 years), or perhaps at worst Sydney Metro Northwest (which took 5 years).
| Engineering Quantity | Upgrade Existing | Truro (north) | Truro (south) | Mount Bold |
| Total Length (km) | 104 | 172 | 154 | 96 |
| New corridor (km) | None | 122 | 124 | 60 |
| Capacity (mtpa) | 23.6 | 40 | 40 | 40 |
| Rail Bridges (km) | 0.57 | 17.06 | 10.45 | 22.55 |
| Tunnels (km) | 2.34 | 8.45 | 8.35 | 24.18 |
| Level Crossings | 5 | 10 | 7 | 12 |
| Undiscounted CapEx | $700m | $2,900m | $2,400m | $3,000m |
| Discounted CapEx | $568m | N/A | $1,710m | $2,009m |
| Years construction* | 5 | N/A | 9 | 12 |
| Updated Construction | 3 | N/A | 5 | 6 |
| Updated CapEx | $612m | N/A | $1,968m | $2,383m |
The ARFMS assumed that any impediments to double-stacking beyond Murray Bridge, and at Melbourne, would be removed as part of a separate project, not considered in the economic analysis. We retain this assumption, but note that as of 2023, the proposed Western Intermodal Freight Terminal (WIFT) in outer Melbourne is expected to remove double-stacking constraints between Geelong and the North-South corridor sometime after completion of Inland Rail, probably in the late 2020s or early 2030s. While a solution for double-stacking into the Port of Melbourne is not yet planned for the coming decade, we assume that WIFT will effectively resolve the double-stacking issues at Melbourne, and that the cost to modify the few significant structures remaining between Murray Bridge and Geelong would be proportionally small, and can be ignored.
Demand Estimates
Demand estimates should have three components: 1) base case forecasts, 2) diverted traffic, and 3) generated traffic (see Australian Transport Council 2006 guidelines, Vol3, s.2.4 – “Make demand estimates”). The ARFMS considered only the first of these – its demand forecasts were based entirely upon an estimated growth rate of the existing rail freight demand across the corridor, projected out 30 years. They did not include any estimates for either diverted or generated traffic. We shall first review the base-case forecast against the actual performance in the decade since the study’s completion, and then make our own estimates of diverted and generated (induced) traffic.
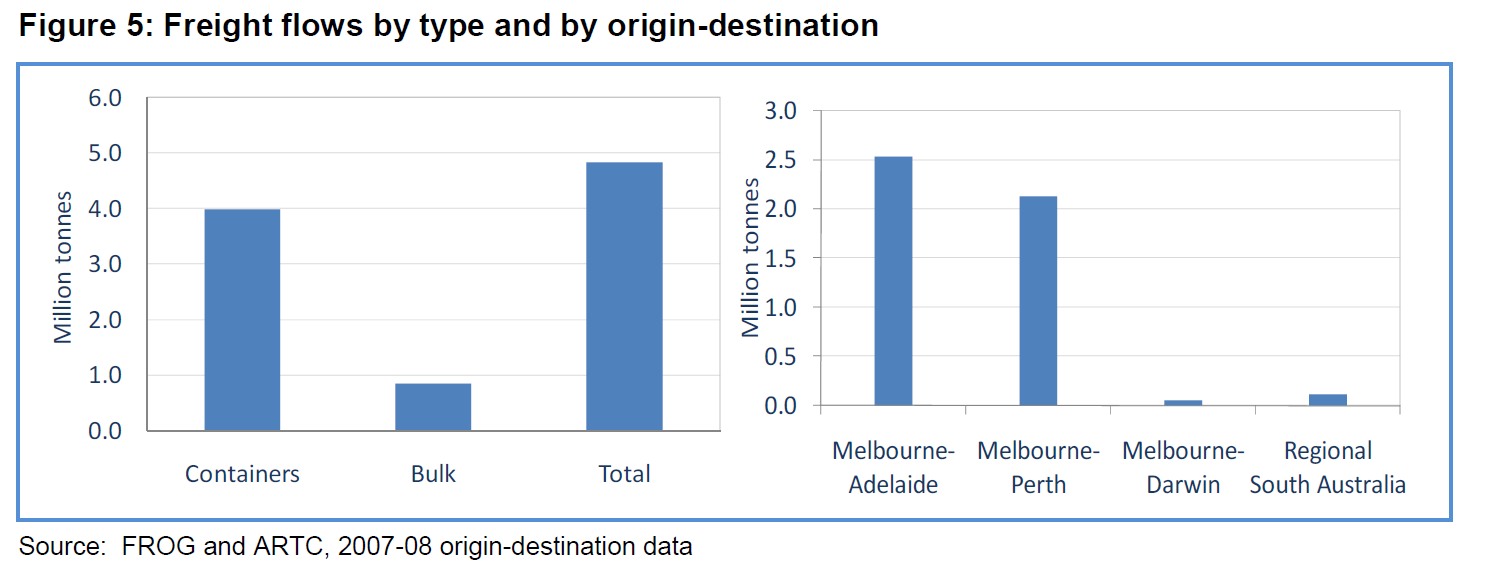
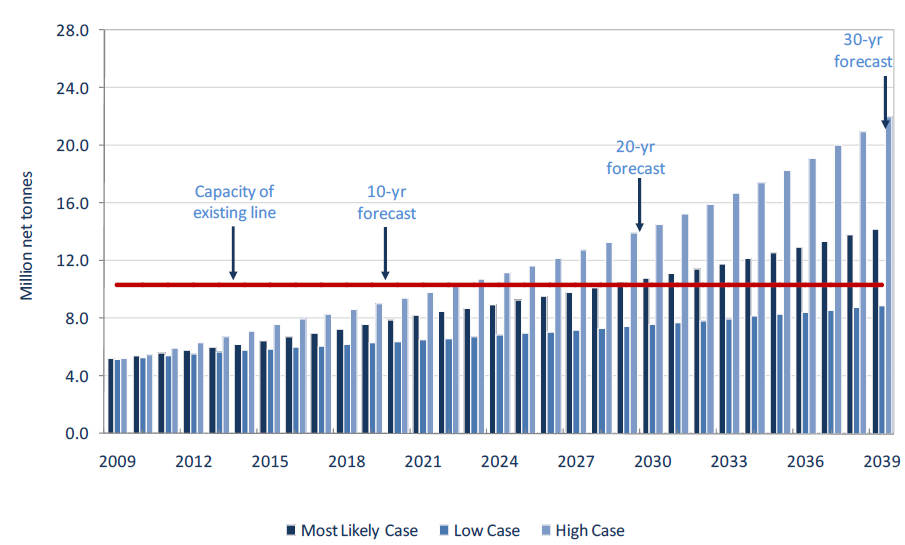
The latest available data at the time of the study was for the 2007/08 financial year. In that year, the corridor carried 4.8 million net tons per annum, 82% of which was intermodal. The vast majority (96%) was Melbourne-Adelaide and Melbourne-Perth freight, with the remaining 4% mostly bulk grain from regional South Australia. The central estimate of future freight growth was 3.6% per annum from 2009-2039, an estimate which was endorsed by all major freight operators at the time (in fact, consensus was that this was a conservative estimate); they also included low and high growth estimates of 2.0% and 5.0%, respectively.
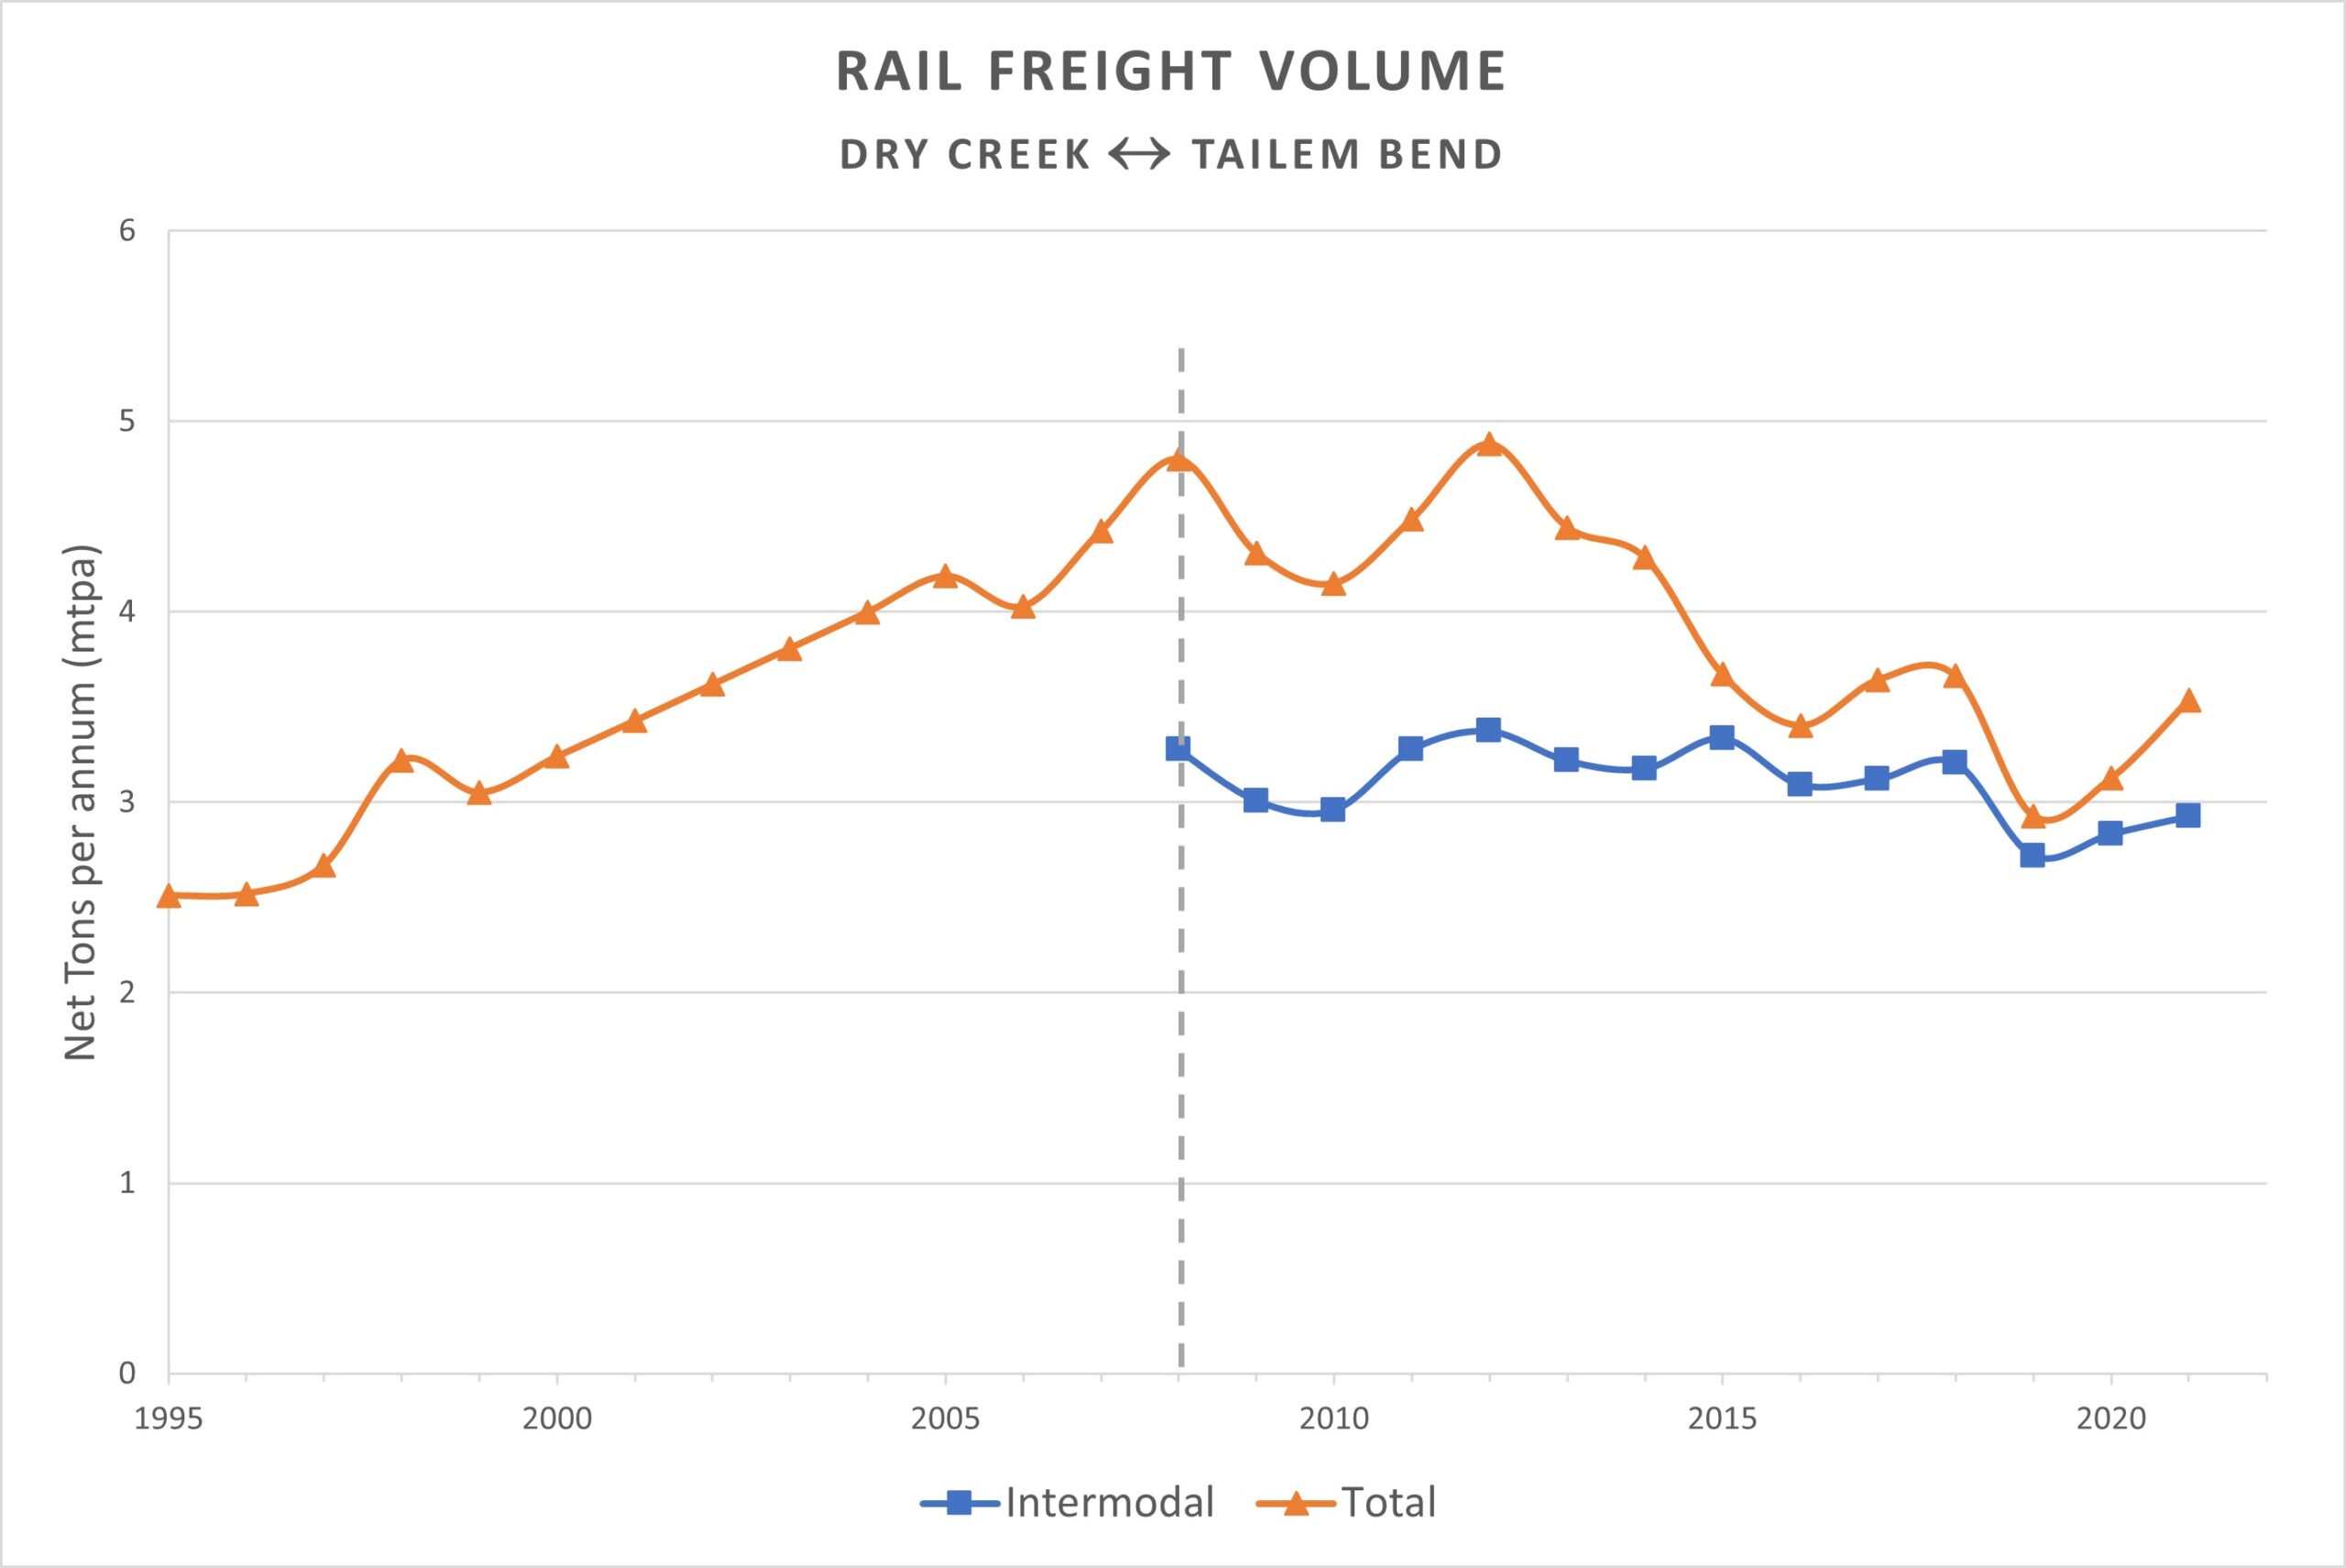
In fact, since the ARFMS the rail freight task in the Adelaide Hills declined from a peak in 2011/12 of 4.9mtpa (Trainline 3), to a pre-pandemic low of 2.9mtpa in 2018/19 (Trainline 8). This is a 41% drop over 7 years – a compound annual growth of -7% per annum, at the same time that the overall freight task has continued to grow in excess of +5% per annum! Furthermore, bulk volumes have collapsed from 1.5mtpa in 2008, to just 0.2mtpa in 2019, though there has since been a partial recovery. The 2018 Tonkin study cited the following reasons for the drop:
- Decline of land-bridged containers between Port Melbourne and Adelaide; around 9 trains per week (18% of 2008 intermodal traffic) have ceased operation. Partially attributable to modal switch to trucks, and partially to increased container capacity at Port Adelaide.
- Brisbane-Adelaide rail traffic, which used to travel via Melbourne, now travels via Parkes and Broken Hill following the completion of double-stacking clearance works on that corridor in late 2008. As of 2008, 7 trains per week had been scheduled on this route, representing 14% of the 2008 traffic.
- Cessation of vehicle manufacturing in Adelaide, resulting in decreased steel volumes
- Closure of the Mindarie Sands mining operation in the Murray Mallee region, which produced around 140,000tpa of heavy mineral concentrate.
Another factor not mentioned, but undoubtedly of great importance, is the significant reform of the Australian heavy vehicle industry around the same time, culminating in the Heavy Vehicle National Law of 2014. The HVNL replaced a fractured state-by-state system of regulation, reducing regulatory burden and significantly improving the economics of road-based freight; this was on top of the pre-existing trend towards larger “High Productivity Vehicles”, the fleet size of which had been growing at a compounding 27% per annum since the late 1990s. There has been no comparable reform of the rail sector, worsening its competitive position.
For our review, we shall assume the 2020 freight volume and composition as the base-year volume, ie, 3,100,000 net tons per annum, 35% below the base-year estimate of the ARFMS. We shall retain the 3.6% per annum growth rate, as this is close to the observed level of road freight growth in recent years, as well as the growth in Gross State Product of Western Australia and Victoria, the primary drivers of freight through the corridor. Because of the uncertainty inherent in long-range forecasting, growth beyond 30 years is set to zero in accordance with ATC guidelines.
Diverted traffic
The ARFMS made no estimate of the existing size of the road freight market, or its expected future growth. In fact, it assumes zero modal shift due to increased competitiveness of the railway. The only “modal shift” in their model occurs late in the evaluation period, after the point at which the existing railway would otherwise have reached capacity (this can be interpreted graphically in the ARFMS forecast chart above, as the area above the red line). It has therefore ignored a critical component of demand, ie, what percentage of current and future road freight would divert to an upgraded railway?
Unlike rail freight, no central database of road freight movements exists; we therefore need to rely on some combination of estimates, traffic volumes and surveys. Recent estimates of the SA↔VIC interstate road freight include the following:
- GlobeLink 2019 and Infrastructure SA 2020 both use 13.7mtpa
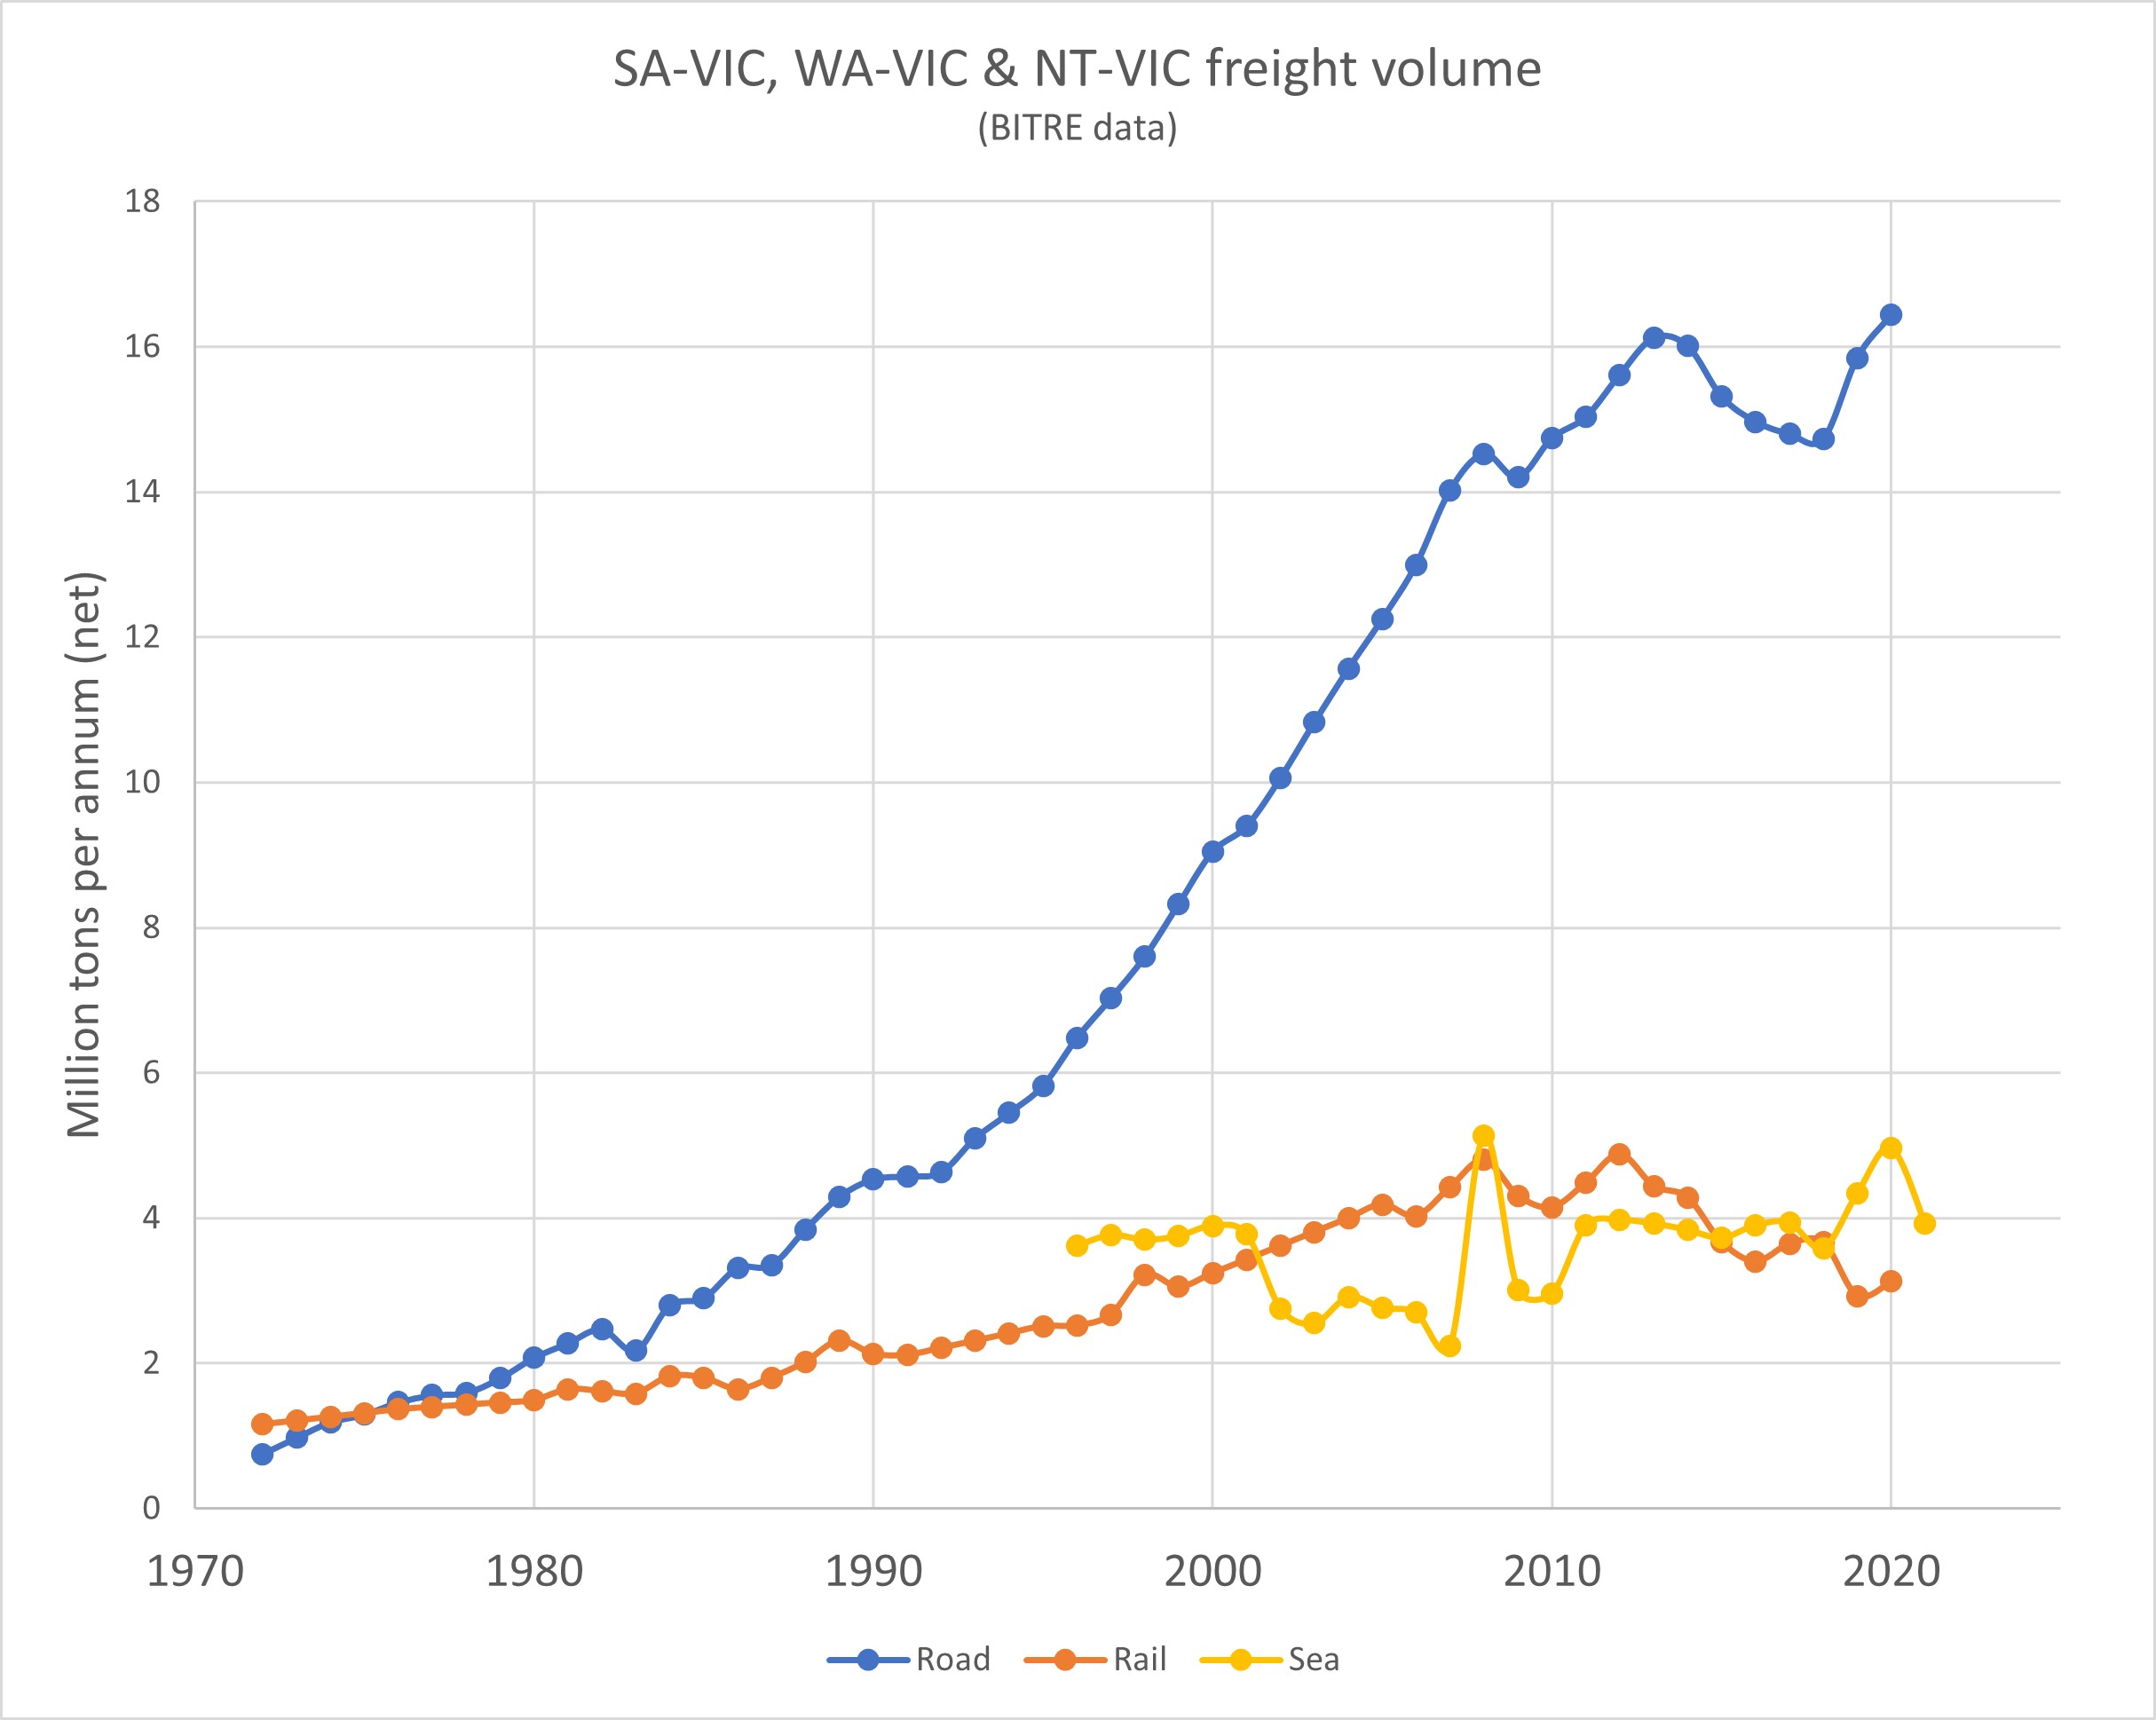
- Data from BITRE (2010 and 2022) suggests a figure ranging from 14.7-16.4mtpa for recent years
- Vehicle counts suggest an even higher figure; there are about 994,000 articulated truck crossings of the SA/VIC border per annum; assuming an average payload per truck of 21.2 tons (ABS 2020), that makes 21.1mtpa of SA↔VIC cross-border road freight.
We shall adopt the Globelink estimate (13.7mtpa), as it is not only relatively recent, but is also one of the most comprehensive freight studies ever undertaken in SA, and has informed subsequent governmental decision making. The vast majority of this (>98% by volume) is between SA and VIC. Within this volume, BITRE in 2006 estimated that approx. 3.8mtpa was intercapital/intermodal (2.8 billion ton-km / 729km road distance); accounting for growth, this would be around 6.5mtpa by 2020.
Intra-state freight
The intra-state SA road freight market is vast (GlobeLink estimates it at 152mtpa), but very little of it is realistically contestable. The overwhelming majority of intrastate trips are short distance (<200km), and not located within the catchment area (i.e, the south-east of the state). As noted above, intra-state freight currently accounts for under 4% of the railway’s current traffic, and is almost all bulk grain. It’s therefore worthwhile looking at how large the grain market could potentially be. The 2023 grain harvest of 12.8 million tons was the largest in South Australian history (almost 75% above the 5-year average), with about 2.7 million tons coming from the Murray, Murray-Mallee and South-East regions. While this is a substantial potential market, capturing any significant percentage of it would require the reopening of several closed or dormant branchlines, which is not currently in prospect. Intra-state freight is therefore not likely to be a significant driver of traffic in the short term, absent a concerted effort to reopen the regional branchlines.
Sea freight
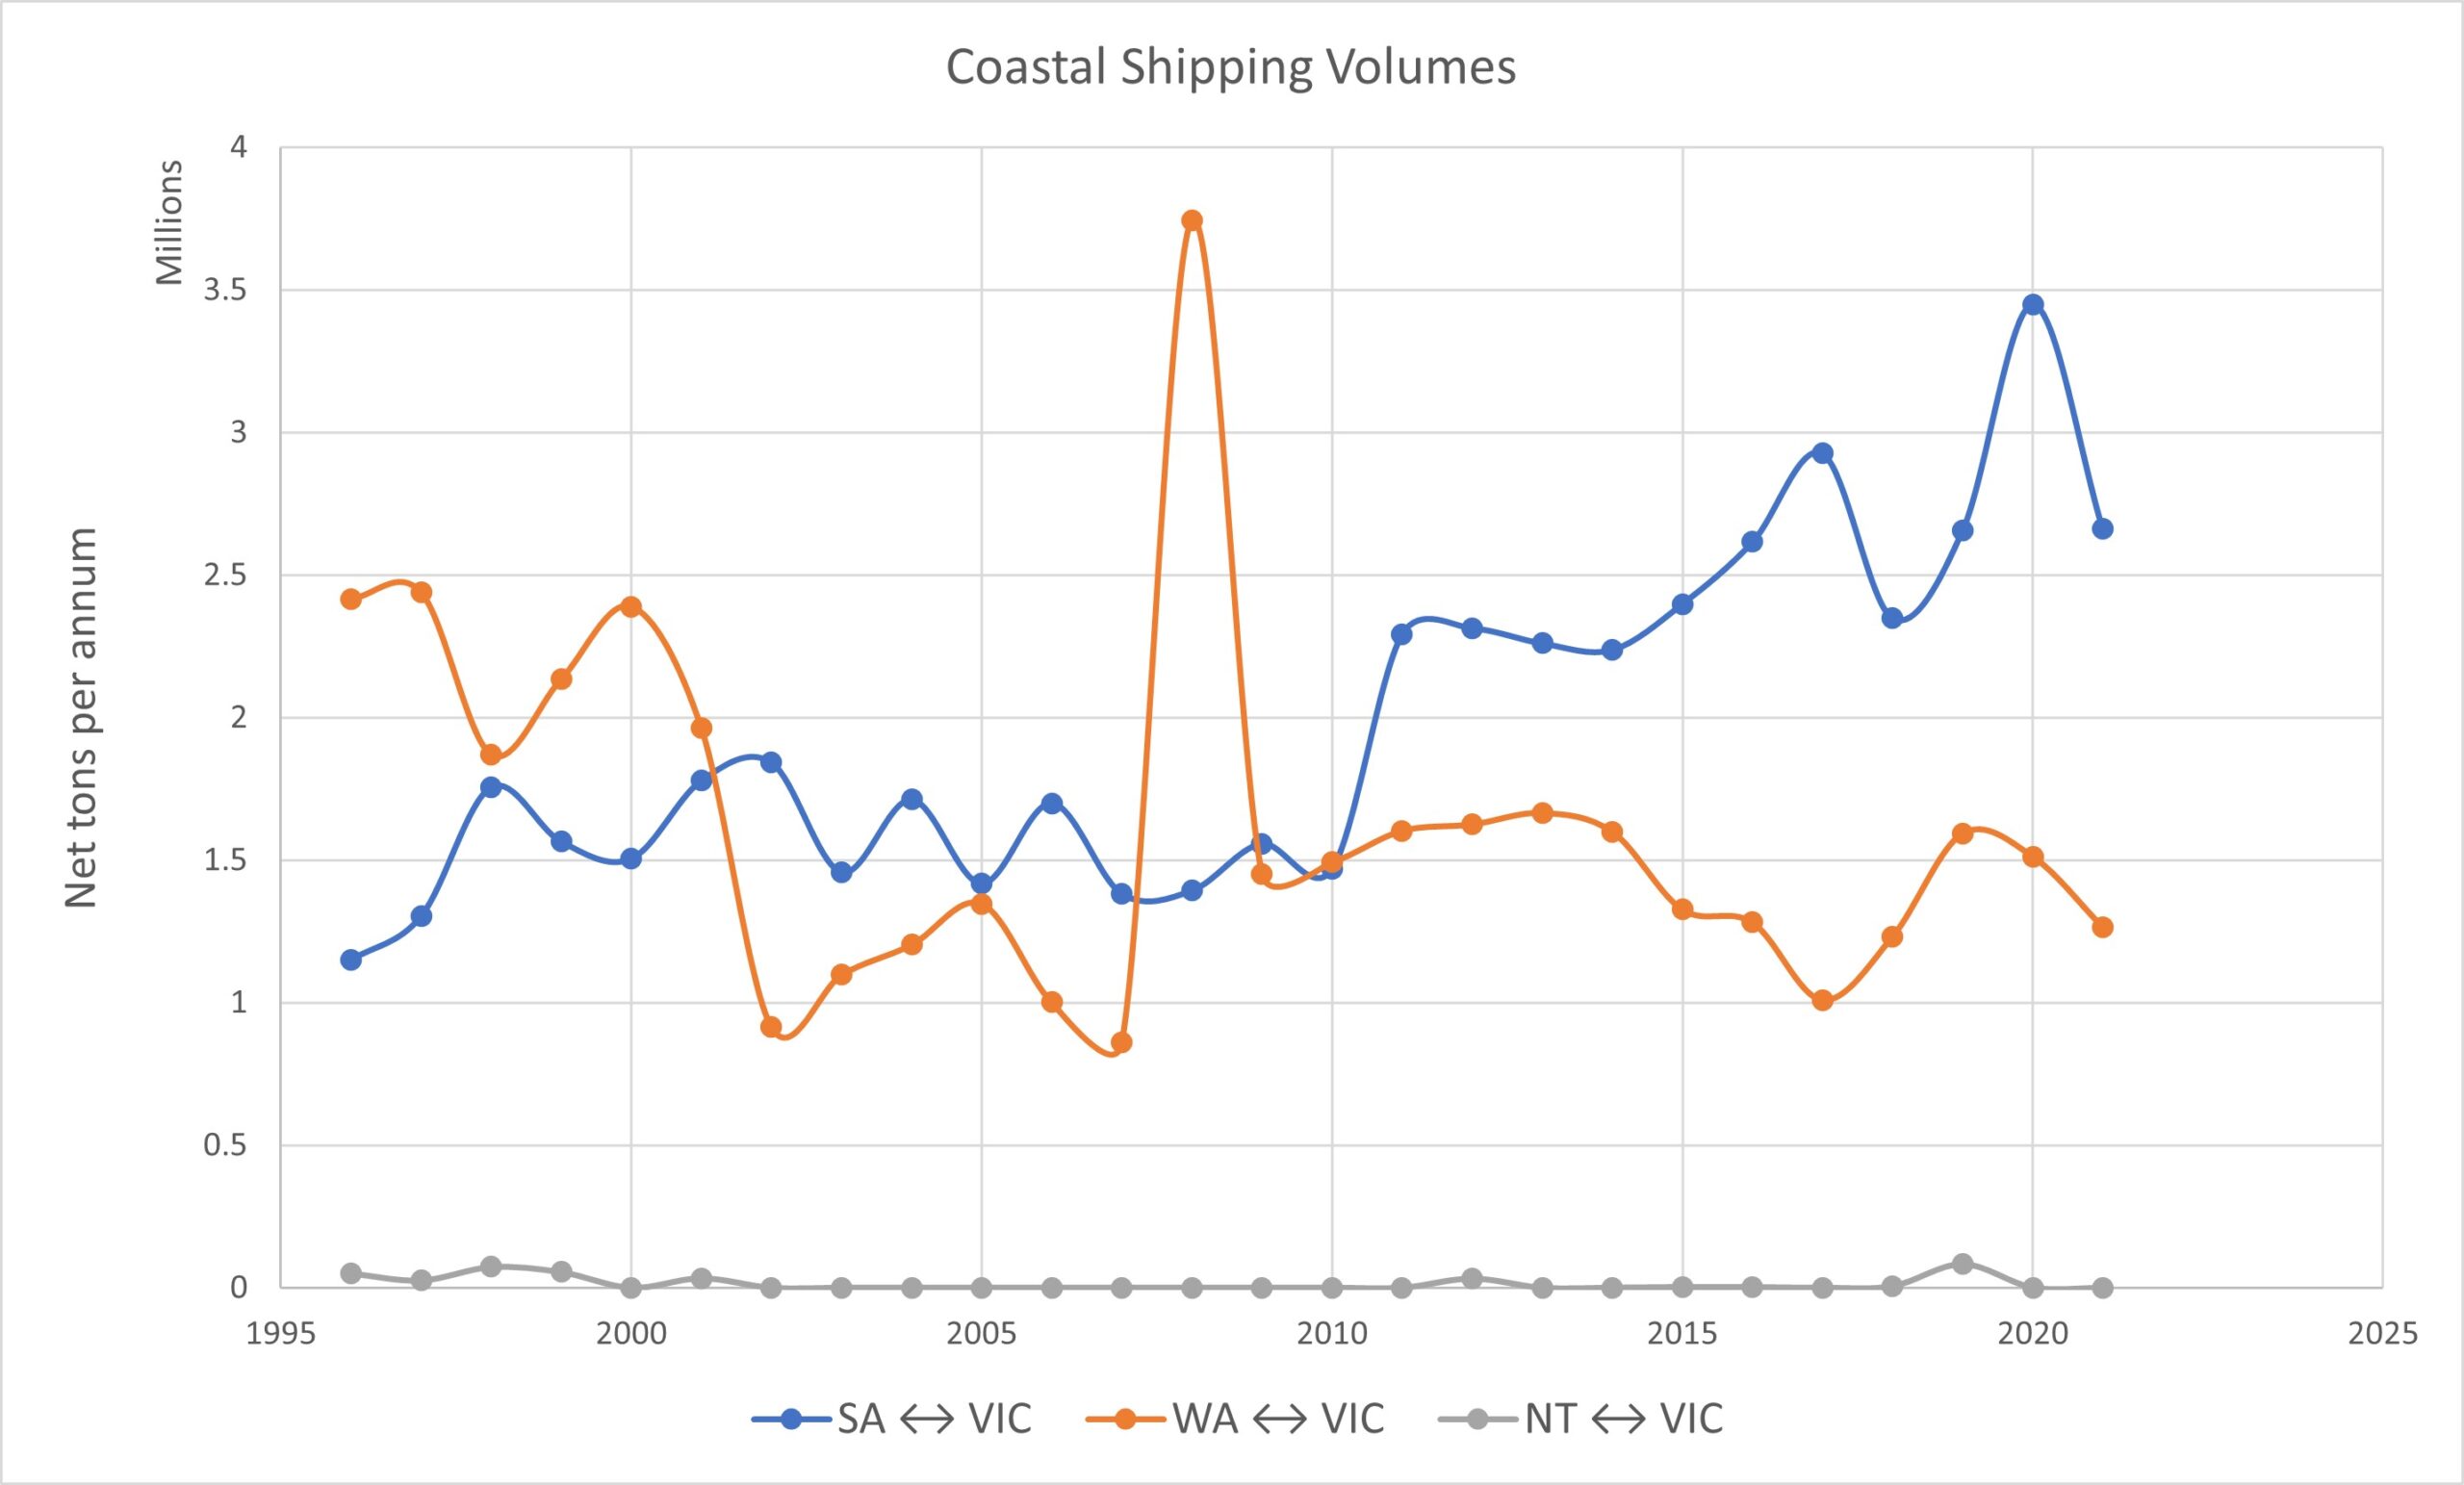
Rail freight doesn’t just compete with trucks, but also with coastal shipping, a freight mode which has been enjoying something of a renaissance since the shipping reforms of the early 2010s. Indeed, the annual BITRE report “Australian Sea Freight” shows that since 2010, SA↔VIC shipping has been growing at an annualised rate of 6.5%, much faster than the wider freight market. The scale of the market is surprising – it actually exceeds current rail volumes by a considerable margin, with 3.4 million tons shipped between SA and VIC, and 1.5 million tons between VIC and WA in 2020. The SA volumes are particularly interesting given sea freight’s competitive disadvantage over shorter routes. There is therefore a case that the market capture from coastal shipping could be significant.
According to Ports Australia, the primary products carried by coastal shipping are (in order) dry bulk mining products (mainly bauxite, alumina and iron ore), liquid bulk products (crude oil, petroleum products and other liquids), with containers and non-bulk Bass Strait freight making up the smallest proportion. The following significant product flows are of potential relevance to the Adelaide-Melbourne railway:
- Fremantle to Melbourne – about 30,000 TEU/annum of containerised freight (0.30-0.45mtpa)
- Fremantle/Bunbury to Portland/Geelong – approx. 1.1mtpa of bulk alumina
- Port Bonython (Whyalla) to Geelong – 950,000 tons per annum of LNG and crude hydrocarbons
BITRE’s Transport Elasticities Database (Table 155) suggests the cross-elasticity of demand for sea freight is high; between Perth and the Eastern States it is 1.51 for road and 2.29 for rail (ie, for every 1% decrease in the price of rail, rail would capture 2.29% of sea freight). This suggests that rail could capture substantial volumes from sea, especially for containerised freight for which the cost saving (due to double stacking) will be large. The BITRE Information Sheet #34 contains a good discussion of the relative competitiveness of road, rail and sea freight in Australia.
Generated (Induced) Traffic
Induced traffic is separate to diverted traffic, being defined as additional transport demand that did not previously exist, that emerges as a direct result of improved transportation infrastructure. Its prediction relies on the microeconomic responses of businesses to changes in operational parameters, and is therefore challenging to perform with accuracy.
One interesting scenario would be the reintroduction of land-bridged containers but in the opposite direction, from Adelaide to Melbourne, as a potential solution to relieve near-term capacity constraints at Port Melbourne. The existing Outer Harbour terminal has a near-term capacity excess of around 50,000 TEU/annum (PWC 2017, “The Future of Intermodal Terminals“), suggesting that inducing 0.5-1mtpa of such freight would be technically possible with existing infrastructure.
This, of course, is speculation. The reality is that induced traffic is extremely difficult to quantify, especially given the complexity and uncertainty of the freight market, and the multiple external factors at play (changes in production patterns, international and domestic shipping rates, government policy, etc). We will therefore not include induced demand in our central estimate. However, it’s important to recognise that it is a potential source of additional demand and could therefore enhance the benefits of the project.
Public Submissions
A draft Discussion Paper for the ARFMS was released on 9 October 2009. It presented the main alignment options, their costs, and the future freight projections – but not the economic analysis – for public review and comment. The deadline for submissions was set at six weeks later, November 20. A total of 76 submissions were received, 27 from freight sector participants and 49 from community groups, residents, and local government. The submissions are archived on the Wayback Machine, accessible here.
The responses from the freight industry make for interesting reading; they generally reflected a sentiment, in the words of the SCT Logistics submission, “that the restraints associated with the geometry of the infrastructure in the Adelaide hills have gone unaddressed for too long, and therefore should have significant priority within the overall planning of the national rail network.” The study’s central estimate of a 3.6% CAGR for freight volumes was broadly endorsed, and if anything was considered conservative.
Interestingly, almost every freight operator emphasized a preference to explore additional options for upgrading the existing railway, particularly regarding easing of existing curvature (for example, see the works proposed in the 2001 Interstate Rail Network Audit, s6.4.2). Curiously though, the ARFMS rejects any “improve existing” option on strategic grounds, for two reasons: firstly, that compulsory acquisition of housing would be required, and secondly, the inability of an improved existing alignment to meet operators’ minimum requirements, especially a sub-1% gradient. Neither of these reasons are among the criteria cited in the report’s own Strategic Fit Analisys (page 29).
The first reason can be readily dismissed – housing acquisition is common in South Australian road and rail projects (evidenced in recent years by the extensive North-South Corridor project) and would not pose a problem on the scale required for easing curvature through the Adelaide Hills. Although the costs of such acquisition remain relevant, it should not outright disqualify the option.
The second reason is the more interesting. The ARFMS classifies a sub-1% ruling gradient as a “desirable limit,” not an absolute one. The Inland Rail project shares this desirable limit but has adopted steeper gradients in areas of mountainous terrain, such as the new Toowoomba Range Crossing and the existing climb from Melbourne to Heathcote Junction.
The report’s decision to reject an improved existing alignment based on the gradient criterion contradicts the approach of other major rail projects. It is also inconsistent within the report itself, since the “upgrade existing” and “do nothing” options also fail to meet this criterion and should logically be excluded. The motives behind dismissing an “improve existing” option, advocated by numerous operators, remain unclear in the Strategic Fit Analysis. A separate, intriguing consideration is whether a more cost-effective alignment could have been designed by adopting a steeper ruling gradient. However, that topic falls beyond the scope of this review.
The Benefit-Cost Analysis
The ARFMS’s Benefit-Cost Analysis was performed according to the Australian Transport Council’s 2006 guideline, “National Guidelines for Transport System Management in Australia“; this is the predecessor to today’s Australian Transport Assessment and Planning (ATAP) guidelines. It is a national agreement upon the appropriate standards for appraisal of infrastructure proposals, endorsed by all states and territories, in the same vein as the National Road Rules or National Firearms Agreement – an agreement by the States to adopt common standards and practices, but falling short of a prescriptive federal law.
The ATAP guidelines are effectively a “cookbook” for infrastructure assessment – while they allow substantial variation in methodology according to the individual requirements of each project, as well as the information and resources available to study authors, they do ultimately provide an objective yardstick against which any individual project appraisal can be judged. This critique is therefore not merely our own opinion against that of the study authors, but rather an assessment of the ARFMS against those guidelines.
General Comments
The analysis performed by the ARFMS was a so-called “Rapid BCA”, intended to quickly screen out initiatives that pass the Strategic Merit Test, but are unlikely to pass a detailed assessment. Due to the unsatisfactory results of the Rapid BCA, none of the options progressed to detailed assessment.
The ARFMS does not go into great detail to explain its methodology, and is therefore challenging to review. In numerous cases, the parameters used to evaluate benefits are not justified or even described. In the following section, we will review the information presented by the ARFMS, and utilizing their assumptions and the ATAP guidelines, we’ll “reverse-engineer” the methodology, explicitly describing our own method and referencing any parameters used. It is important to note that while we have gone to some effort to accurately reproduce the ARFMS methodology, in many cases we do not definitively know what assumptions were used, and they may be at variance with our method.
The Rapid BCA was performed over a 30-year evaluation period with a discount rate of 7%. This is already concerning; while 30 years is the standard evaluation period for road projects, the rail standard is 50 years (see ATC Vol3, s.2.2.4). Furthermore, the life of rail assets is 100 years (ATC Vol4, s5.5), so a substantial residual value should be accounted for at the end of the evaluation period. Both these standards were implemented in the Inland Rail business case; the ARFMS’s failure to do so will have a material impact on the viability of the project.
It also appears that the study’s evaluation period of 30 years is inclusive of construction. Correct practice is for the evaluation period to be 30 (or 50) years in addition to construction (see ATC Vol3, s.2.10.2). This foreshortening of the evaluation period further underestimates the benefits, particularly in light of the study’s already-noted excessive construction period. Excluding construction, the study’s effective lifetime for the Mount Bold option is just 18 years – 40% less than if a full 30-years had been evaluated, and almost two thirds less than the appropriate period of 50 years.
The numerical value of benefits are not always explicitly given in the report; therefore, we have used summary column charts to graphically estimate those values. The total benefits for each option are however explicitly given, and therefore can be relied upon to verify the graphical estimates. The benefits are summarised in the following table, in present value terms:
| Economic Benefits | Upgrade Existing | Truro Route | Mount Bold Route |
| Below-rail operating costs | $4m* | $6m* | $7m* |
| Land transport operating costs | $91m* | $46m | $99m |
| Freight transit times | $0 | $56m* | $84m* |
| Level crossing delays | $2m* | $8m | $6.5m |
| Transport externalities | $1m* | -$39m | $7.5m |
| TOTAL | $98m | $77m | $204m |
The ARFMS considers five benefits categories within the project appraisal: three “operational efficiency benefits” (below-rail operating costs, land transport operating costs, and transit time), and two “social benefits” (level crossing delays, and externalities). We’ll examine each of these, aligning them with the ATC 2006 guidelines and making necessary revisions. We shall for now retain the study’s original 30-year evaluation period, though extending it to 30 years after completion of construction (for the avoidance of doubt, this means an evaluation period of 33 years for the Upgrade Existing option, 35 years for Truro, and 36 years for Mount Bold).
“Below rail” operating costs
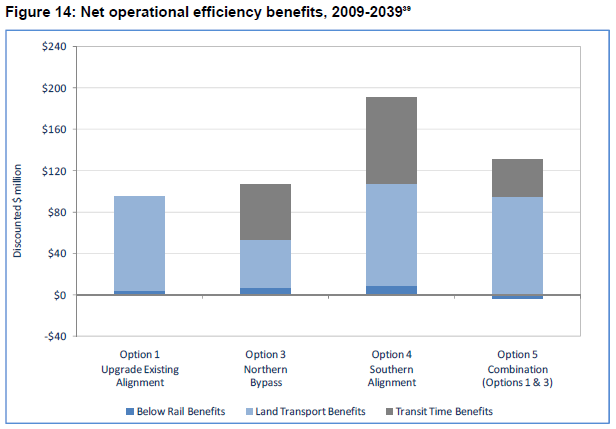
“Below rail” refers to the costs of operating and maintaining the railway itself, rather than the trains that run on it (“above rail”); it would be classified as an Infrastructure Operating Cost under the ATC guidelines. The ARFMS treats this benefit as “a function of age followed by length of alignment”. The new bypasses, even where longer than the existing railway, incur lower maintenance costs than the base case due to being newer track. In any case, the magnitude of the estimated benefits is small – Fig. 14 on Page 37 indicates a range from about $4 million in the lowest case (upgrade existing) to $7 million in the highest (Mount Bold).
Applying the study’s assumptions about construction and evaluation period, we can infer annual savings per track-kilometre of: $5,000 for Upgrade Existing, $18,000 for Truro, and $12,000 for Mount Bold. The difference in these figures can be explained by the “Upgrade” option retaining a larger proportion of existing (older) infrastructure, and the Mount Bold route incurring a substantial operating cost penalty due to its very long tunnel.
This seems like a reasonable benchmark – ARTC in 2019 spent $154 million on maintenance of its 8,500km network, which amounts to $18,100/km. However, it has historically ranged from about $10,000/km to over $30,000/km, depending on route segment. The existing Adelaide Hills section would be at the higher end of this range; a saving of $18,000 per kilometre is therefore reasonable.
Retaining the original savings per track-km, but modifying for construction and evaluation period, makes only a marginal difference; the updated present-value of this benefit is:
- $5 million for Upgrade Existing
- $11 million for the Truro route
- $12 million for the Mount Bold route
There would be no change to below-rail operating costs along the wider Melbourne to Perth network, as no change is proposed to that infrastructure.
Land transport (“above rail”) operating costs
The study describes these benefits as “mainly reflect[ing] the economies of scale that train companies obtain from running 1800 metre double-stacked trains in the alignment options.” The Truro and Mount Bold options would additionally derive benefits from improved alignment, and differential distance. Benefits from modal shift (road to rail) were small in magnitude and occurred late in the study period, so we can ignore them in our review (though we shall consider them separately, later). The benefit is lowest for the Truro route ($46 million, present value) due to the longer distance travelled, highest for the Mount Bold route ($99 million) due to being shorter and less steep than the existing route, with the upgraded existing route also performing well ($91 million).
We can convert these present value savings into $/ton carried, using Excel’s NPV function and the study’s assumed freight volumes for each year. We can then isolate the different components of the benefit under the following assumptions:
- Upgrade gives double-stacking benefits only, with no change to alignment or distance
- Truro gives double stacking, improved alignment but longer distance
- Mount Bold gives double stacking, improved alignment and shorter distance
- Operating cost by distance = $0.04 per net-ton-km (NTK) – BITRE Information Sheet 90, 2017
| Savings $/net-ton | Upgrade | Truro | Mount Bold |
| Double Stacking | $1.37 | $1.37 | $1.37 |
| Alignment | $0 | $1.67 | $0.66 |
| Distance | $0 | –$2.15 | $0.32 |
| TOTAL | $1.37 | $0.89 | $2.35 |
Note that the alignment benefit is substantially smaller for Mount Bold than for Truro, despite both routes being designed to the same specifications, and both eliminating the need for banking engines. This implies an operating cost of about $1/ton applicable to the very long Mount Bold Tunnel ($2,000-$3,000 per train). This is a reasonable expectation (in line with modelling for the long Inland Rail tunnel at Toowoomba), as such a tunnel would incur substantial expenses for ventilation, maintenance and other operational requirements.
But we are most interested in the magnitude of the double stacking benefit, particularly the percentage saving assumed by the ARFMS. The consensus estimate is around 25% of operating costs (see e.g. the Inland Rail Business Case 2015, Tonkin 2018, GlobeLink 2019, and CSIRO 2022); our own operating cost model (based on ARTC’s 2001 Interstate Network Audit) supports such a figure as conservative. Indeed, if we take BITRE’s $0.04/NTK as the base-case operating cost, we find costs of $5.64/net-ton over the 141km between Murray Bridge and Two Wells, thus the double-stacking saving amounts to $1.37/$5.64 = 24%. This seems to line up neatly with the above sources.
Except there is in fact a significant miscalculation here. While the alignment and distance components of operating cost benefits are only applicable over the bypass itself (141km), the double stacking component is applicable over the entire route, ie, Melbourne to Adelaide (836km) or Melbourne to Perth (3,483km). The base-case freight costs for these routes should be around $33/ton (MEL-ADL) and $139/ton (MEL-PER), with associated double-stacking savings of $8/ton and $35/ton, respectively. Weighted for relative proportion, this comes to an average of $26.09/ton. If, on the other hand, we are to assume that the ARFMS figure of $1.37/ton does refer to the entire route, this would imply a double-stacking saving of (at most) $0.0007/NTK, or under 2% of operating costs; this is implausibly low under any reasonable assumptions.
A narrow study area is confirmed repeatedly in the study text: Figure 1 (shown below) from the report’s Executive Summary identifies the “Study Area” as between Murray Bridge and Two Wells, there is an explanation that the benefit is derived from running double-stacked trains “in the alignment options” (pp. 35), a description of “significantly” different distances between options (pp.36), and the following quote from the study conclusion, which makes quite clear that wider network effects were not considered:
There are a number of issues that, whilst outside the scope of this Study, will need to be considered in future deliberations about rail infrastructure and operations (freight and passenger) in the greater Adelaide region…
…in order to fully understand and capture all the impacts of a major infrastructure investment, consideration needs to be given to the network-wide impacts.
Section 7.2, “Conclusions” (emphasis added)
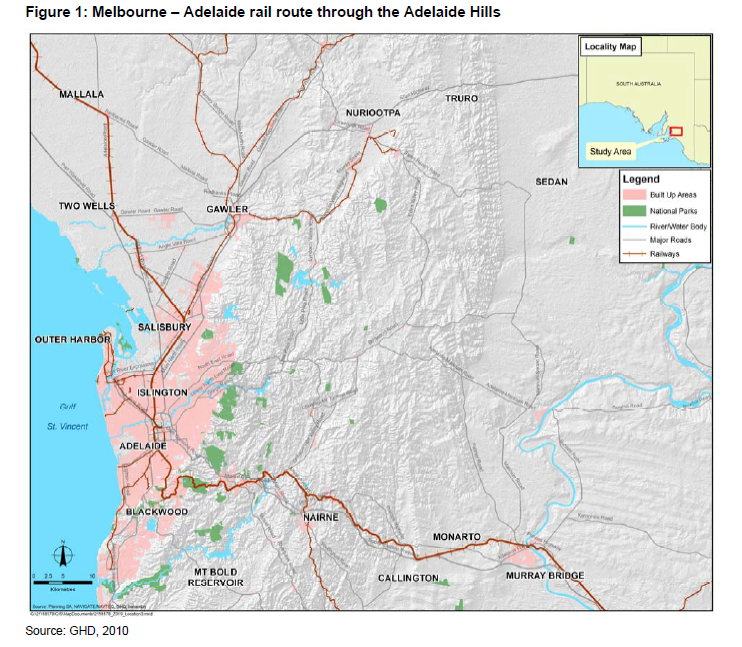
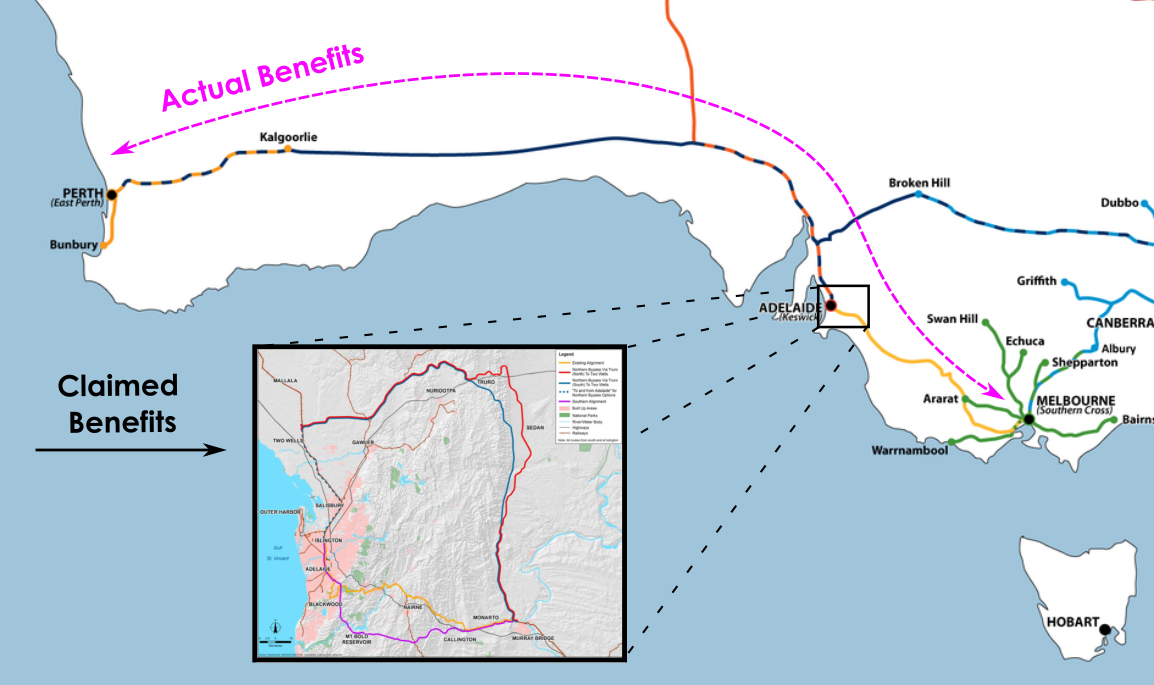
Restricting the project benefits to just the Adelaide Hills region is contrary to the ATC Guidelines for estimating user benefits (see either ATC Vol3, s2.7 – Cross-modal and network effects, or the current ATAP guideline T2, Step 7). It also defies logic; any freight that switches to double-stacked is going to remain double-stacked for the entire journey, not just between Murray Bridge and Two Wells, and consequently derive benefits for the entirety of that journey. Resolving the Adelaide Hills double-stacking bottleneck would deliver a network-wide benefit, not one confined narrowly to the upgraded track section.
Certainly, all of the Adelaide-Melbourne freight would benefit, but although the Adelaide-Perth section is already double-stack capable, the current bottleneck prevents operators from making full use of that capability. A majority of Melbourne-Perth freight currently goes single-stacked the whole way – only a minority is re-stacked in Adelaide for the remainder of the journey (the current Master Train Plan indicates that only half of MEL-PER freights stop at Islington at all, and few of those stops are long enough to allow any significant reconstitution of loads). And of course, for any freight that does get re-stacked at Islington, there are significant costs and delays associated with this process. CSIRO modelling estimates this cost at $80 per 40-foot container for each loading cycle – this equates to around $3.60/ton on typical loadings – plus a delay on the order of 10 hours – another $10+ per ton! The costs are so significant that the benefits of the upgrade to existing double-stacked freight are almost equivalent to that of single-stacked.
When we adjust for this, the entire economic forecast changes dramatically. Using the savings we calculated above for MEL-ADL and MEL-PER freight, and the updated freight forecasts, the present value of this benefit is summarised in the following table. Additionally, for interest, we present what the present value would have been on the original study’s freight forecast – it is evident that with the 2010 freight forecasts, above-rail OpEx benefits alone should have been of sufficient magnitude to exceed net present costs.
| Operating Cost Benefit (PV) | Upgrade Existing | Truro | Mount Bold |
| Opex Savings $/net-ton | $26.09 | $25.61 | $27.07 |
| Base Year Savings | $81m | $79m | $83m |
| Present Value* | $1,340m | $1,233m | $1,262m |
| PV on original forecast | $2,075m | $1,909m | $1,954m |
| Original study value | $91m | $46m | $99m |
* Half construction time of the original study, 30-year evaluation period, updated freight estimate
Supporting arguments
Given the magnitude of our revision to the ARFMS figure, we feel it is prudent to offer additional evidence in support of our position, and to place our figure (and that of the ARFMS) within the proper context of the overall market.
1 – Differences between the options. We note that the magnitude of the estimated benefit to land transport operators differs significantly between the ARFMS options – there is over a 100% difference between the Truro and Mount Bold options ($46 million vs. $99 million in net present benefits). This is not what would be expected for a relatively small bypass delivering network-wide benefits to a much longer corridor; we would expect only a small difference, commensurate with the difference in distance over the whole route, not just the short bypass itself.
Furthermore, the report states:
An important driver of the size of land transport benefits for each alignment option is the distance travelled by trains. (…) This difference is primarily due to the significantly shorter track distance that trains need to travel when accessing Adelaide using the Southern Alignment compared to the Northern Bypass route.
ARFMS pp. 36 (emphasis added)
This is prima facie evidence that the operating cost benefits have been calculated along just the bypass route itself, rather than the entire route; it can be seen that the difference in distance between the options is around 10% for MEL-ADL freight, and well under 1% for MEL-PER freight.
| Truro (south) | Mount Bold | % difference | |
| Distance MEL-ADL | 915km | 820km | 11.6% |
| Distance MEL-PER | 3,496km | 3,475km | 0.6% |
| Distance Murray Bridge to Islington | 191km | 96km | 99% |
2 – Comparison with Inland Rail. Inland Rail is fundamentally the same kind of project as the Adelaide Hills Bypass, achieving network-wide benefits with a bypass of a slow and inefficient legacy route. Inland Rail is modelled to save existing rail customers between $10/ton (The Case for Inland Rail, 2015) and $33/ton (Inland Rail Supply Chain Mapping Project, CSIRO, 2022) over the 1,731km BNE-MEL corridor, and assuming 40% of trains would be double-stacked. Proportionally modifying this for the much longer length of the Melbourne-Perth corridor, we would expect the savings due to an Adelaide Hills upgrade to be in the order of $30-$90/ton for Melbourne-Perth freight (suggesting our weighted average assumption of $26/ton is well on the conservative side), and certainly not in the order of $1-$2/ton as modelled by the ARFMS.
It’s also worth noting that Inland Rail is expected to reach an intercapital/intermodal net tonnage of 7.9mtpa by 2050 (The Case for Inland Rail, 2015). The ARFMS estimated that by 2039, the Adelaide Hills corridor would handle somewhere between 15 and 22mtpa – almost three times the projected Inland Rail task, and over a far longer corridor at that! The Hills Bypass is therefore a project that should logically deliver benefits in the same order as Inland Rail.
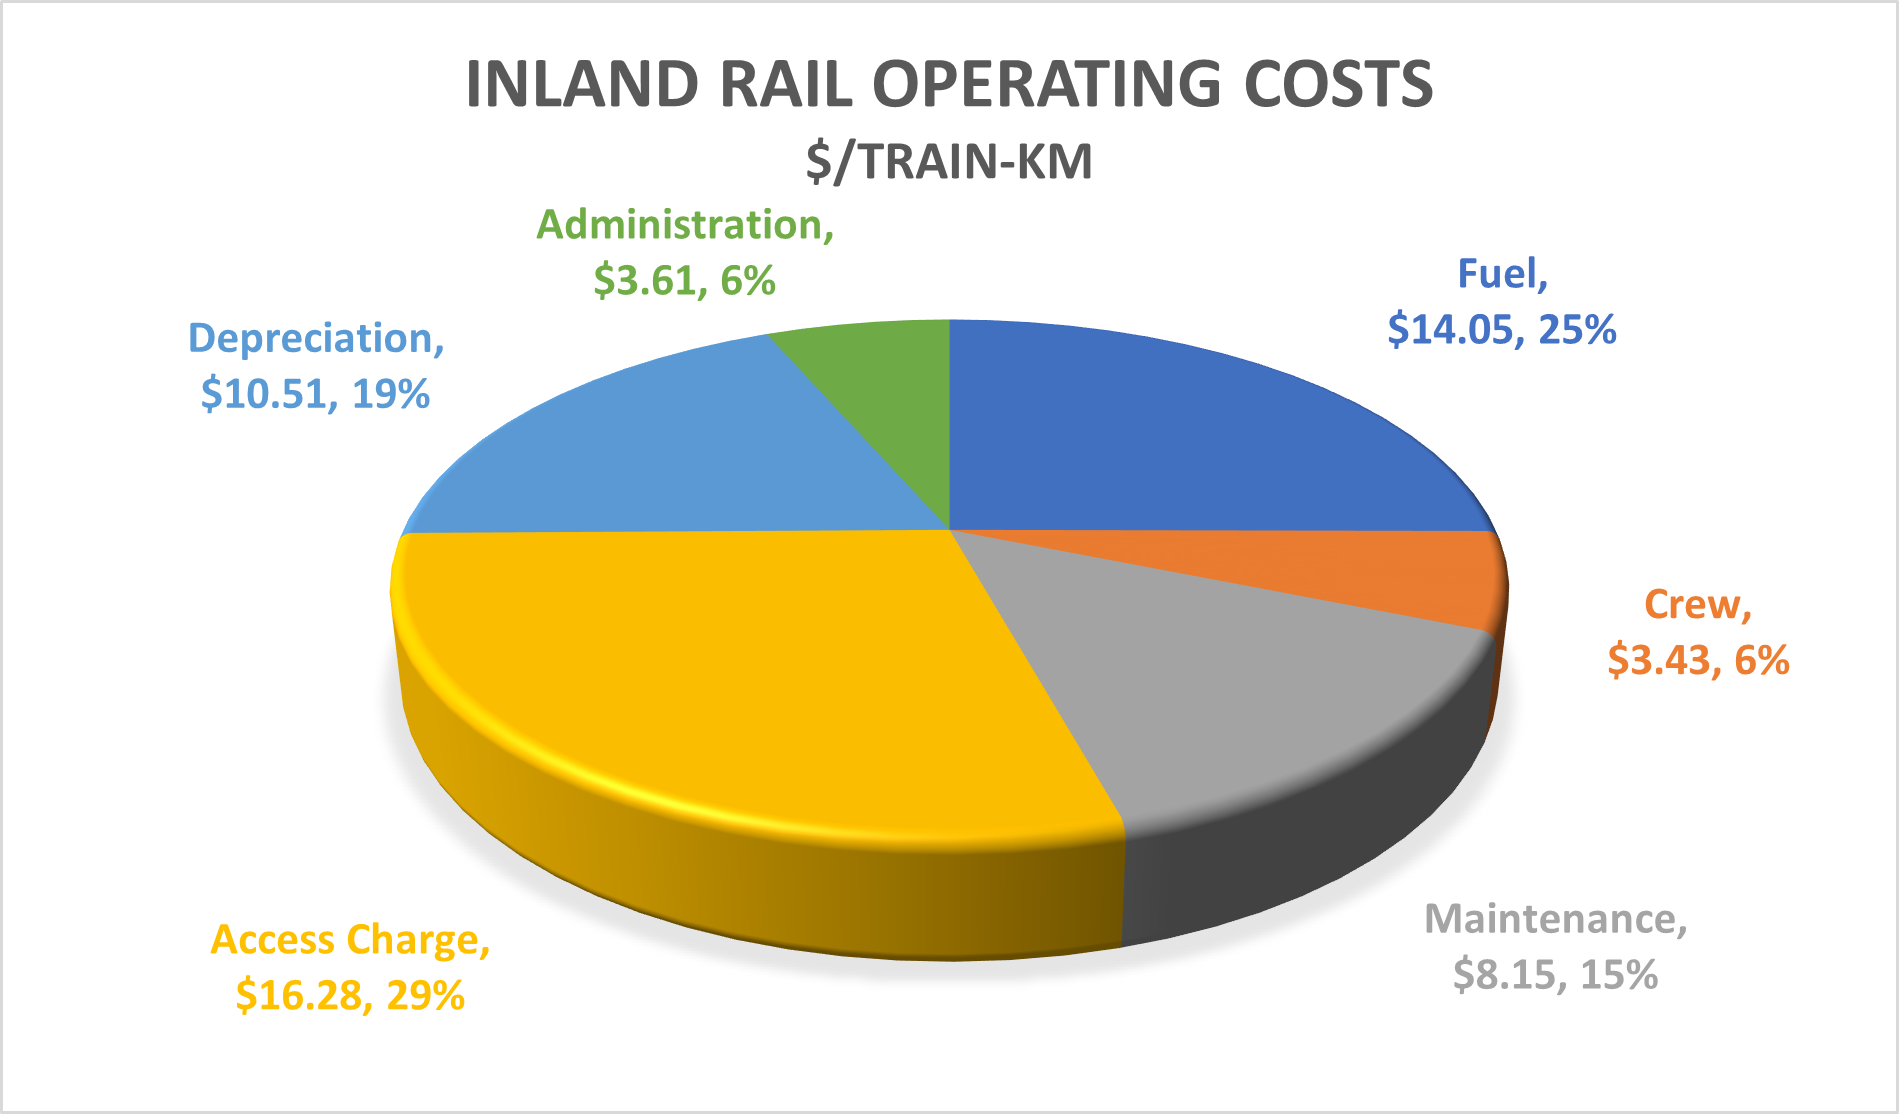
3 – Sizing the market. The undiscounted value of our corrected double-stacking benefit comes to about $80 million per annum on current freight volumes, which implies that the total current above-rail operating costs for the ADL-MEL and MEL-PER rail freight market should be in the order of $360m/annum. What’s the actual number?
It turns out we can make a pretty good estimate of the above-rail operating costs of this corridor using freight data and ARTC access revenue. BITRE’s annual Trainline publication records freight volumes on each section of the ARTC network; we can see that the 2018-19 non-coal freight task on the ARTC network was 55.2 billion gross-ton-km (GTK), excluding the Kalgoorlie-Perth section, which is not ARTC-owned. Of this, MEL-ADL and MEL-KAL freight together make up 15.2 billion GTK. That’s 27% of all non-coal GTKs carried on the entire ARTC network.
ARTC report their access revenue separately for the Hunter Valley coal network, and the mostly intermodal Interstate network. Interstate network access revenue in 2019 was $273 million, therefore MEL-KAL and MEL-ADL freight would have accounted for around $74 million in access charges in that year. The Inland Rail Alignment Study estimated access charges would come to around 29% of operating costs for the Reference Train (40% double-stacked, 4,800 gross tons); this would imply the market size to be $255 million, or $313m including the extra 650km from Kalgoorlie to Perth. This is in the right ballpark.
A separate method using older OpEx data from the ARTC Interstate Network Audit (2001) indicates a market size of $184m/annum ($296m in 2019 dollars), on volumes of 2.95mtpa. While this is close to the current volume of 3.1mtpa, the share of long-distance MEL-PER freight has increased, suggesting total market size would be proportionally larger as well. This is also supports our conclusion.
On the other hand, if we take the ARFMS’s operating costs as referring to the whole route, rather than just the bypass alignments, it would compel us to accept a market size of no larger than $27 million per annum in 2008 ($5.64/ton x 4.8mtpa = $27m/annum). This is an implausibly low figure given the available data (it would barely cover one third of access charges, let alone all other costs).
4 – If not this, then what? Since 2010, several alternative proposals have been seriously advanced in order to improve the economics of Melbourne-Perth rail freight, notably the rerouting of intermodal freight via Parkes, and an alternative bypass alignment between Mildura and Menindee. Both of these proposals would involve significant extra travel distance and time over the current route – 700km for Parkes and 400km for Menindee – so this can give us a good indication of how the market values the cost penalty of the existing Adelaide Hills route.
Let’s look particularly at the Parkes option, as it is expected that a majority of Melbourne-Perth freight will be redirected via this route after the completion of Inland Rail in the second half of this decade (indeed, following the Schott Review of January 2023, this is now touted as a key rationale of the Inland Rail project). Sending MEL-PER freight via Parkes and Broken Hill will incur a detour of some 700km compared to the direct route via Adelaide. The cost penalty of this detour would be $0.04 x 700 = $28 per ton, necessarily implying that the direct cost penalty of the existing Adelaide Hills route exceeds this amount. This is very close to what we calculated earlier; multiplied by the then-current 4.8mtpa freight volume through the Adelaide Hills, that’s an operational saving of $134 million per annum.
If the Parkes detour truly is competitive with the existing Adelaide Hills route, then the ARFMS figure for double-stacking benefits cannot stand. For a 700km detour to somehow cost less than $1.37/ton would require an operating cost on the Parkes route of less than $0.002/ton-km. This is an order of magnitude below any reasonable estimate of operating costs, double-stacked or not.
Each of the above four contextual arguments supports the conclusion that the ARFMS has significantly underestimated the benefits to land transport operating costs. One can debate by how much, but the broad conclusion is demonstrated. By neglecting to account for broader network effects, the ARFMS underestimated operating cost benefits by an order of magnitude – at least 10x, and possibly 20x or more.
Modal Shift
Before we move on to the other four benefit categories, we’ll look at a subset of Land Transport Operating Costs, i.e., modal shift from trucks to rail. The ARFMS explains: “These benefits reflect the track capacity limitation in the Base Case. That is, the existing track is expected to reach its capacity limit from the mid-to-late 2020s, which means rail cargoes above this limit will instead be transported by road transport.” It is evident that the ARFMS has not accounted for any near-term modal shift due to improved competitiveness of the railway.
Even though road freight is relatively inelastic to rail prices, assuming zero modal shift is justifiable only if operational benefits were non-existent, or demand was perfectly inelastic. Both these assumptions are unrealistic; direct operating cost savings as well as non-cost enhancements are substantial, and estimates for the elasticity of demand with respect to rail prices are given below (from BITRE Information Sheet 34, and BITRE Transport Elasticities Database).
| Elasticities | Road | Rail | Sea |
| Short Haul | 0.35 | -1.1 | 1.41 |
| Long Haul | 0.66 | -1.1 | 2.29 |
We shall therefore make an estimate of the likely near-term modal capture, looking at four subcategories of demand – intercapital intermodal, interstate regional, intrastate and coastal shipping – and to what extent they would benefit under each of the upgrade scenarios. It’s important to note that this approach assumes a degree of success in enhancing the competitiveness of rail relative to other modes. If this is not achieved, then the demand for the upgraded railway, and hence the benefits of the project, could be significantly lower than our estimate.
- Upgrade Existing delivers double-stacking capability, slight reliability improvement, but no improvement to gradient or speed.
- Truro Route delivers improved gradient, speed and reliability, but longer route distance (substantially so for ADL-MEL freight).
- Mount Bold Route delivers improved gradient, speed and reliability, as well as shorter distance.
Generalised cost savings
The percentage market capture is dependent on the generalised cost savings and the elasticity of road freight demand to rail prices. “Generalised” cost savings include not only direct operating costs, but also travel time and reliability, converted to a dollar benefit (see the following section, “Transit time & Reliability“, for details on their derivation).
| Savings ADL-MEL $/net-ton | Upgrade | Truro | Mount Bold |
| Alignment | $0 | -$0.48 | $0.98 |
| Time | $0 | $0.44 | $1.98 |
| Reliability | $0.91 | $3.65 | $3.65 |
| Total | $0.91 | $3.59 | $6.59 |
| % ADL-MEL | 3% | 11% | 20% |
| % Regional | 5% | 18% | 33% |
| % Intrastate | 11% | 45% | 83% |
Intercapital Intermodal
In “Demand” we estimated that interstate road freight between SA and VIC consists of around 6.5mtpa intercapital/intermodal. The percentage market capture is dependent on the generalised cost savings and the elasticity of road freight demand to rail prices.
Adelaide-Melbourne intermodal freight would see generalised cost savings, including double stacking, of 28-45% for the various options; multiplied by a cross-elasticity for short-haul routes of 0.35, we find modal shifts of 10% (Upgrade), 13% (Truro), and 16% (Mount Bold)
Bulk Regional
Bulk and other non-containerised freight travelling between destinations other than the capitals comes to 7.2mtpa by our estimate. Assuming an average trip length of 500km (approx. Adelaide to Stawell, in the centre of western Victoria), generalised cost savings range from 5%-33%, corresponding to modal shifts of 2% (Upgrade), 6% (Truro) and 12% (Mount Bold)
Bulk intrastate
While the total volume of intrastate freight is very large, only a small proportion is in the target region, and still less would be likely to use rail. The grain harvest for the region is no more than 2.8mtpa. Mining opportunities are limited, perhaps accounting for a further 0.2mtpa of concentrated mineral products. We therefore estimate that no more than 3.0mtpa of intrastate freight could be considered contestable in the best case, and even this would require substantial reactivation of grain or mineral handling facilities. Furthermore, the trip distance of this freight would be relatively low – we assume a typical distance of 200km (equivalent of Adelaide to Tintinara). This means that the generalised cost savings of the upgrade will be a large percentage of total journey cost, but the absolute magnitude of the benefit will be proportionally smaller.
Assuming a contestable market of 3.0mtpa, modal shift would range from 0.12mtpa (upgrade existing) to 0.87mtpa (Mount Bold).
Coastal shipping
Coastal shipping is a potentially large source of modal shift, with about 1.5mtpa currently transported between Perth and Melbourne, and as much as 3.5mtpa between Adelaide and Melbourne. However, shipping’s low cost (about $0.03/NTK) suggests that only freight with large potential savings would have a clear incentive to switch mode – i.e., Melbourne to Perth Intermodal. Cross-elasticity of demand is high (2.3), therefore, around 60%-70% of this market could be expected to switch to rail (0.22-0.25mtpa). While there is a modest penalty in operating costs, this is more than compensated for by the significant travel time savings, typically 48 hours. In total, intermodal freight that switches to rail would have generalised cost savings of between $42 and $49/ton.
SA-VIC coastal shipping is significant in volume (3.5mtpa), and the potential generalised cost savings for bulk freight implies a strong potential capture of up to 30% (1.0mtpa). However, the freight flows are largely locked into existing infrastructure configurations (eg, no rail access to Port Bonython, Eyre Peninsula grain isolated from ARTC network). Major works would be required for any significant modal shift of this freight. We will therefore exclude it from our estimate, but noting it as another potential driver for significantly higher freight volumes.
Modal Shift Summary
| Modal shift (mtpa) | Upgrade | Truro | Mount Bold |
| Intercapital/Intermodal | 0.63 | 0.81 | 1.02 |
| Bulk Regional | 0.11 | 0.45 | 0.83 |
| Bulk Intrastate | 0.12 | 0.47 | 0.87 |
| Coastal Shipping | 0.22 | 0.23 | 0.25 |
| Total | 1.08 | 1.97 | 2.96 |
| OpEx savings $/annum | $39.2m | $65.5m | $100.7m |
| Present Value (30 years) | $650m | $1,017m | $1,373m |
Incremental Access Revenue
This significant boost in freight volume carried by the railway would result in increased access revenues to the railway owner, in the order of $50m/annum, which would have an NPV of almost $800m over 30 years. However we do not include this in an economic cost-benefit analysis, as it results in a corresponding reduction of income for trucking and coastal shipping companies. From the perspective of the whole economy, the benefit is fully accounted for by the operating cost savings calculated above. A financial analysis, for example from the perspective of the ARTC, would consider access revenue, however that is beyond the scope of this review.
Transit Time & Reliability
The report describes transit time benefits qualitatively as being related to the value placed by retailers and wholesalers on faster door-to-door transport. The expected travel time savings are up to 2:12hrs in the best case (Truro route, MEL-PER). The magnitude of benefit is not stated, but we can estimate it graphically from Figure 14 as: Upgrade existing $0, Truro route $56 million, Mount Bold route $84 million – in both cases, a respectable fraction of total benefits.
Given the expected freight volumes and travel time savings, these numbers infer a relatively high time value of $1.10 per ton-hour. This is around twice the ATC 2006 default value of $0.54/ton-hour (AustRoads 2006). However the later Globelink study (KPMG 2019) uses a much higher figure of $1.12/ton-hour, close to that used by the ARFMS. We will therefore retain the value of $1.10/ton-hr; this values the travel time benefit on current freight volumes at $5.5m/annum for Truro, and $6.1m/annum for Mount Bold. We do not account for any transit time benefit due to eliminating restacking delays, assuming that any such benefit will have been fully accounted for under Land Transport Operating Costs.
We shall also include reliability in this category, as a significant non-cost driver of project benefits. According to AustRoads (2011), reliability improvements can account for some of the largest benefits of transport projects – ranging from 5% to 50%! The Adelaide Hills corridor has notoriously low reliability; estimates range from 74% (2001 Interstate Network Audit) to as low as 55% (ARTC Performance Indicators, 2021). This compares to a reliability target of 98% for Inland Rail, or 95% for road freight. Given these benchmarks, a reliability improvement of 20% appears a reasonable and conservative estimate.
We convert the reliability percentage increment to a generalised cost by finding the price increment that would induce an equivalent change in demand. The 2001 Rail Network Audit estimated rail’s demand elasticity to reliability at +0.6, and to price at -1.1. Therefore a 20% increase in reliability would induce a demand increase of 12%. The same demand increment would be induced by a price decrease of 12%/1.1 = 11%. Applied to ADL-MEL operating costs ($33/net-ton) the value of reliability improvements therefore comes to $3.65/ton.
| Upgrade | Truro | Mount Bold | |
| Average time saving | 0 | 1.6 hr | 1.8 hr |
| Reliability improvement | 5% | 20% | 20% |
| Time benefits (annual) | $0 | $5.5m | $6.1m |
| Reliability benefits (annual) | $2.8m | $11.3m | $11.3m |
| Total benefits (30-year PV) | $52m | $287m | $289m |
Level crossing delays
The ARFMS quantifies this benefit over the 30 years at $8m for the Truro option and $6.5m for Mount Bold, with the Upgrade Existing option graphically estimated at $2m. Assuming the level crossing benefit is proportional to expected freight growth, this implies an annual benefit in the base year of $750,000 for both bypass options, and $150,000 for the upgrade option.
These figures appear underestimated, despite the methodology appearing similar to ours. Consider that both the Upgrade Existing and Mount Bold options included a grade separation of Cross Road; this one crossing alone would have benefits comparable to the study’s figure. Cross Road has an AADT of over 30,000 vehicles per day, and sees 88 suburban passenger train movements per day in addition to 10 or so freight movements on the ARTC line. We estimate that just Cross Road alone could account for over $750,000 per annum in savings, ignoring all other crossings.
Taking the traffic at each crossing from the DIT traffic counters (or estimating where no data exists), freight and passenger train numbers between 6am-9pm, estimating delays of 1min per passenger train and 3.5min per freight train, and using reasonable estimates of vehicle occupancy and value of time, our updated travel time savings are summarised below. The economic benefits are well in excess of the ARFMS numbers, but still a small proportion of total benefits (<1%). It’s worthwhile to note that a large proportion of the benefits are obtained at just the three highest-traffic level crossings.
| Upgrade | Truro | Mount Bold | |
| Crossings bypassed | None | 41 | 30 |
| Cross Rd Grade Separation | Yes | No | Yes |
| Main Rd, Blackwood Grade Separation | Yes | No | No |
| Main Rd, Glenalta Grade Separation | Yes | No | No |
| Annual savings | $1.59m | $1.98m | $2.01m |
| NPV (30 years) | $26.4m | $30.7m | $30.2m |
| Top-3 % | 100% | 43% | 61% |
Transport externalities
The ARFMS explains this benefit as “represent[ing] the lower noise, air and water pollution, nature and landscape impacts that freight movements have on surrounding residents and the environment”. In a conspicuously implausible result, the Truro Bypass is calculated to cause a net disbenefit of $39m over the study period, primarily due to significantly increased noise pollution. The study acknowledges some uneasiness with this result, stating on page 38: “This is surprising given that the Northern Bypass is a relatively flat alignment that mainly traverses small rural townships. The consequent noise intensity and impost of freight train movements on local residents should be markedly lower than the status quo.” Yet the result is retained based on default values given in the ATC guidelines. The study explains: “…the magnitude of noise benefit is a function of alignment length as opposed to severity of impost on local residents.”
The ATC guidelines do indeed give default externality values for various transport modes in cents per net-ton-kilometre, however it is clear that a distinction is made between urban and rural locations. The default ATC values for rail externalities are only applicable to urban areas. This is apparently the source of the counterintuitive result in the ARFMS – applying an urban value to both urban and rural locations.
The ATC values for rail externalities are themselves cited to Philip Laird (2005), “Revised Land Freight External Costs In Australia”, which does give both urban and rural values. Adjusting Laird’s numbers for inflation, the total externality costs for rail come to 0.58c/NTK (urban), or 0.23c/NTK (rural). Furthermore, the ARFMS estimate makes no account of double stacking. The components of external costs are all proportional to train-kilometres (not ton-kilometres), therefore should derive the same proportionate benefit from double-stacking, ie, 25%.
We can therefore calculate the externality benefits for existing freight, making reasonable assumptions about the length of each route that would be considered “urban” or “rural”; we also remove tunnels from this total. To avoid overestimating the effective benefit for Perth-bound freight, we classify some 1,600km of the route as “remote” (Port Augusta to Kalgoorlie), for which we set the externality to zero.
| | Upgrade | Truro | Mount Bold |
| ADL-MEL distance Urban/Rural | 101/733 | 38/877 | 70/734 |
| PER-MEL distance Urban/Rural | 168/1753 | 69/1893 | 137/1754 |
| ADL-MEL externality $/ton, no DS | $2.26 | $2.23 | $2.08 |
| PER-MEL externality $/ton, no DS | $4.98 | $4.73 | $4.80 |
| Benefit vs. base case $/annum | $3.16m | $3.58m | $3.57m |
| Present Value (30 years) | $52m | $56m | $54m |
Road Externalities
The rail bypass will not only reduce externalities from existing rail freight, but also from truck freight which switches mode to rail – the ARFMS did not consider this aspect. Although applicable to a lesser freight tonnage, the saving per ton is much larger due to the large differential between road and rail externalities, and the much longer distance over which this differential applies. Laird (2006) estimates the rural externalities of road freight to be over 12 times higher than for rail – a difference of 2.43c/NTK (in 2010 dollars).
The existing road route between Adelaide and Melbourne is 727km, of which 86km is urban and 641km rural, resulting in an externality cost of $20.25 per net-ton for road freight. Using the same assumptions as above, and the modal switch estimates (excluding capture from sea), the benefits of this freight switching to rail are listed in the following table. The percentage saving varies little between the three options, with the overall magnitude mostly dependent on the volume of freight captured.
| Upgrade Existing | Truro | Mount Bold | |
| Modal shift from road (mtpa net) | 0.86 | 1.74 | 2.71 |
| Rail saving | 88.8% | 89.0% | 89.7% |
| Externality benefit (annual) | $13.1m | $20.8m | $29.7m |
| Total Rail + Road (annual) | $16.3m | $24.4m | $33.3m |
| Total NPV (30 years) | $270m | $379m | $501m |
South Eastern Freeway benefits
So far we have confined our review to benefits that were considered by the ARFMS, but correcting for an expanded study area, and near-term modal shift. A further omission by the ARFMS was any consideration of the effects on the South Eastern Freeway. Such a benefit would have three main components:
- Extending the lifetime of the freeway by reducing damage from heavy vehicles;
- Delaying the need to build an alternative route due to the existing freeway reaching capacity;
- Amelioration of ongoing congestion costs on the freeway.
These benefits are summarised as follows:
| Upgrade | Truro | Mount Bold | |
| Lifetime Extension | $65m | $111m | $144m |
| Bypass Delay | $90m | $163m | $240m |
| Decongestion | $27m | $50m | $76m |
| TOTAL | $181m | $324m | $459m |
Let’s look at each of these in turn.
SEF Lifetime Extension
Lifetime benefits were quantified by Tonkin’s 2018 study, which estimated that construction of the Truro Route would result in a 25% (25 year) increase in lifetime to the SEF. Tonkin assumed a replacement cost of $2.76 billion ($36.3m/km x 76km), resulting in a benefit of $689.7 million (25% of the replacement cost) at the end of the 30-year appraisal period, coming to a present value of $60.4m.
In our opinion, this model is unsatisfactory. Tonkin has effectively compared replacing 75% of the freeway in 2054, to replacing 100% of the freeway in the same year – not a good model for what would actually occur. A more realistic method would be to take a present value of the full cost of replacement, discounted from the expected year that it would be required. Additionally, the model should be responsive to differences in the volume of freight diverted from the freeway.
Our model assumes that freeway lifetime is primarily a function of the number of heavy vehicles using it. We convert the annual tonnage of diverted freight to number of trucks per day. We assume the percentage reduction of heavy vehicles using the freeway is equal to the percentage increase in remaining freeway lifetime (base case 36 years, as per Tonkin 2018).
| Base Case | Upgrade | Truro | Mount Bold | |
| Years Lifetime Extension | 0 | 5 | 10 | 15 |
| Replacement required | 2054 | 2059 | 2064 | 2069 |
| Present Value | $226m | $161m | $115m | $82m |
| Benefit | $0m | $65m | $111m | $144m |
SEF Alternatives
Separate to the question of when the SEF will require replacement, is when it will reach capacity and require the construction of an alternative route. This is a much nearer-term prospect, as the freeway is already at its capacity at peak times in several locations. Numerous options have been investigated, with cost estimates ranging from $1.4 billion to over $18 billion. At some point, one or more of these interventions are going to be required – but which one, and when?
- Globelink Proposals:
- Southern bypass (25km) – $1.44 billion
- Northern bypass (37km) – $2.14 billion
- Cross Road Tunnel (17km) – $18.2 billion
- SA Freight Council proposals:
- “South East Link” tunnel (8km) – estimate $8 billion
- Mount Barker Bus Raid Transit proposals:
- BRT tunnel (4km) – $4.0 billion
- Full side-running BRT ($1.8 billion)
- Glen Osmond Road BRT with tidal flow ($300 million)
Well first of all, how much more traffic could the SEF take? According to the latest traffic data (2018), an average of 49,100 vehicles per day use the Crafers section of the SEF. Of these, 5,400 are heavy vehicles. According to the AustRoads Guide to Traffic Management, the capacity impact of each heavy vehicle on a long, sustained gradient such as the Crafers section of the SEF is around 8 passenger car equivalents; therefore the heavy vehicles on the SEF have the same capacity impact as 43,200 passenger car equivalents. This means the SEF currently carries 86,900 passenger car equivalents.
Theoretically, a free-flowing freeway should have a capacity of around 1,800 passenger car equivalents per hour (pc/h), giving the six-lane Crafers section a maximum of 10,800pc/hr. But it’s never going to run flat out, both directions, 24/7 – what’s a practical maximum daily capacity? As an example of a freeway that’s more-or-less at capacity, consider the Sydney Harbour Bridge. Excluding the bus lane, it carries seven highway lanes, therefore its theoretical maximum capacity is 12,600pc/hr. It actually carries about 162,000pc/day, suggesting a maximum daily capacity of around 13x the maximum hourly capacity, even with tidal flow facilities and no significant bottlenecks.
By this method, the SEF would have a maximum capacity of around 140,000pc/day, around 60% higher than 2018 volumes. However, the Portrush Road / Cross Road intersection presents a substantial capacity bottleneck (it currently carries about 72,000vpd, or 110,000pc/day accounting for heavy vehicles) and tidal flow would be difficult to implement on the Crafers section given the layout of the freeway, particularly the Heysen Tunnels. An increase of 40% to 2018 volumes would therefore be a highly optimistic estimate of the SEF’s maximum practical capacity – ie, 120,000pc/day. On current growth trends, that figure will be reached no later than 2033, and probably much sooner (GlobeLink’s assumption was 2026).
Each rail option will capture a percentage of existing road freight, and therefore of the future growth of that freight. We can therefore express each option’s modal capture in terms of the number of years’ growth diverted; this corresponds to the number of years that a freeway alternative could be delayed. We will conservatively assume the lowest-cost bypass option under consideration, i.e, GlobeLink’s $1.44 billion “Short South” bypass.
| Base Case | Upgrade | Truro | Mount Bold | |
| Years growth diverted | 0 | 3 | 6 | 10 |
| Bypass required | 2033 | 2036 | 2039 | 2043 |
| Present Value | $488m | $398m | $325m | $248m |
| Benefit | $0m | $90m | $163m | $240m |
SEF Congestion Reduction
The economic cost of congestion is estimated in the 2015 BITRE study, Traffic and congestion cost trends for Australian capital cities; the figure for Adelaide is estimated at around 12c/pc-km (passenger car kilometre). Assuming a heavy vehicle factor of 8 for the sustained gradient of the 8km Crafers section, and 4 for the remaining 66km of moderate gradient, this equates to an economic congestion cost of $39.40 per heavy vehicle movement on the SEF.
Making the conservative assumption that all captured freight will be from articulated trucks, and none from rigid or light trucks, we can calculate the expected number of trucks diverted, and therefore the avoided congestion cost. The annual ABS Survey of Motor Vehicle Use gives a typical payload per articulated truck of 21.2 tons, which results in the following reductions in congestion:
| Upgrade | Truro | Mount Bold | |
| Mode shift (mtpa) | 0.86 | 1.74 | 2.71 |
| Trucks off the road (per annum) | 41,000 | 82,000 | 128,000 |
| Annual savings | $1.6m | $3.2m | $5.0m |
| Present Value (30 years) | $27m | $50m | $76m |
Benefit-Cost Analysis summary
The following table summarises our updated value for each category of economic benefit, in present value terms over 30 years:
| Economic Benefit | Upgrade Existing | Truro Route | Mount Bold Route |
| Below-rail OpEx | $5m | $11m | $12m |
| Double-stacking | $1,340m | $1,233m | $1,262m |
| Modal shift | $650m | $1,017m | $1,513m |
| Transit time & reliability | $52 | $287m | $289m |
| Level crossing delays | $26m | $31m | $30m |
| Externalities | $270m | $379m | $501m |
| S.E.F. benefits | $181m | $324m | $459m |
| Total Benefits | $2,524m | $3,282m | $4,065m |
| Net Present Value | $1,912m | $1,314m | $1,682m |
| Benefit Cost Ratio | 4.12 | 1.67 | 1.71 |
This is already enough to push all three options well into economic viability. But we’ve still got one more change to make.
Evaluation period
As noted earlier, the ARFMS used an evaluation period of 30 years, while the ATC recommends 50 years for rail projects. Conservatively, and also as per ATC guidelines, we shall assume that freight growth is zero for the extended evaluation period. Under this assumption, the benefits change as follows:
| Economic Benefit | Upgrade Existing | Truro Route | Mount Bold Route |
| Below-rail OpEx | $6m | $13m | $13m |
| Double-stacking | $1,654m | $1,505m | $1,530m |
| Modal shift | $858m | $1,328m | $1,963m |
| Transit time & reliability | $64 | $350m | $350m |
| Level crossing delays | $33m | $37m | $37m |
| Externalities | $357m | $495m | $649m |
| S.E.F. benefits | $188m | $335m | $476m |
| TOTAL | $3,159m | $4,063m | $5,018m |
| Net Present Value | $2,546 | $2,095 | $2,635 |
| Benefit Cost Ratio | 5.16 | 2.06 | 2.11 |
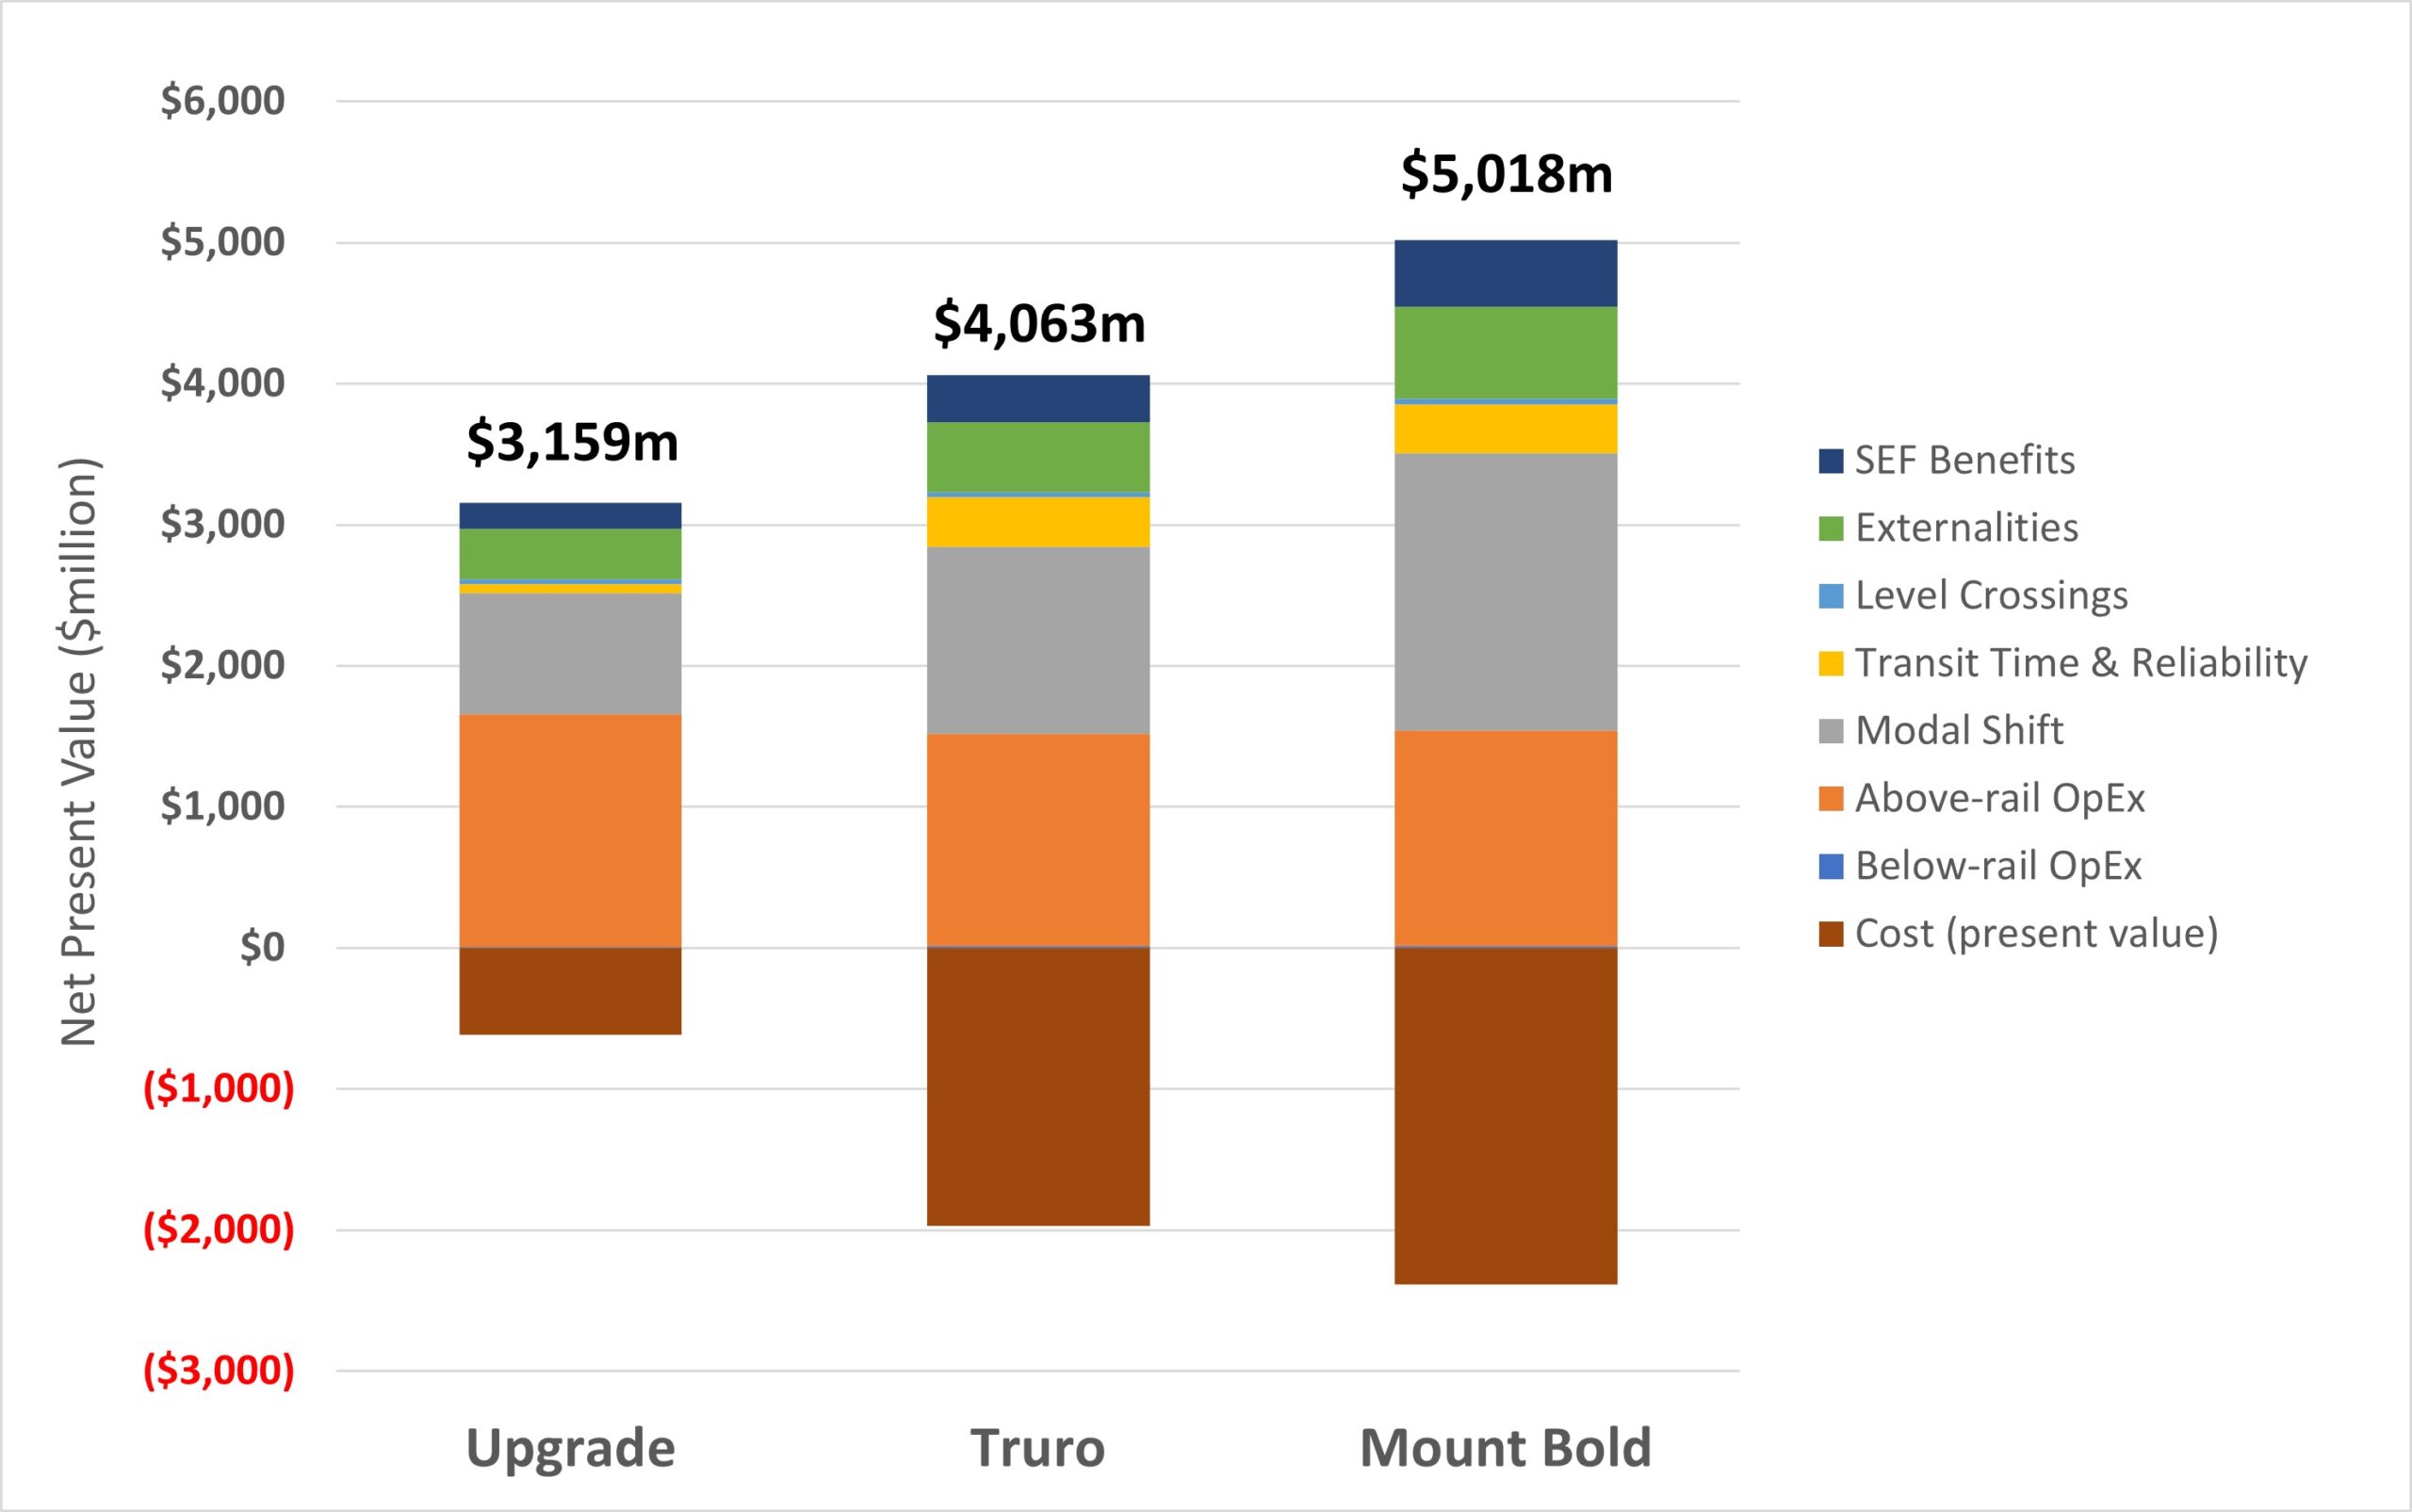
It’s a dramatic contrast with the study’s original numbers; the corrected economic evaluation shows all three options to be economically viable, but the Mount Bold route comes out on top, with an NPV of $2.6 billion, and a BCR of 2.1. The Upgrade Existing option returns a marginally lower NPV of $2.5 billion, but a much higher BCR or 5.2, largely due to its low capital cost. The Truro route returns $2.1 billion in net benefits; while still strongly positive, it is well behind both other options. Its lower capital cost cannot make up for the lesser freight tonnage captured in comparison to the Mount Bold route.
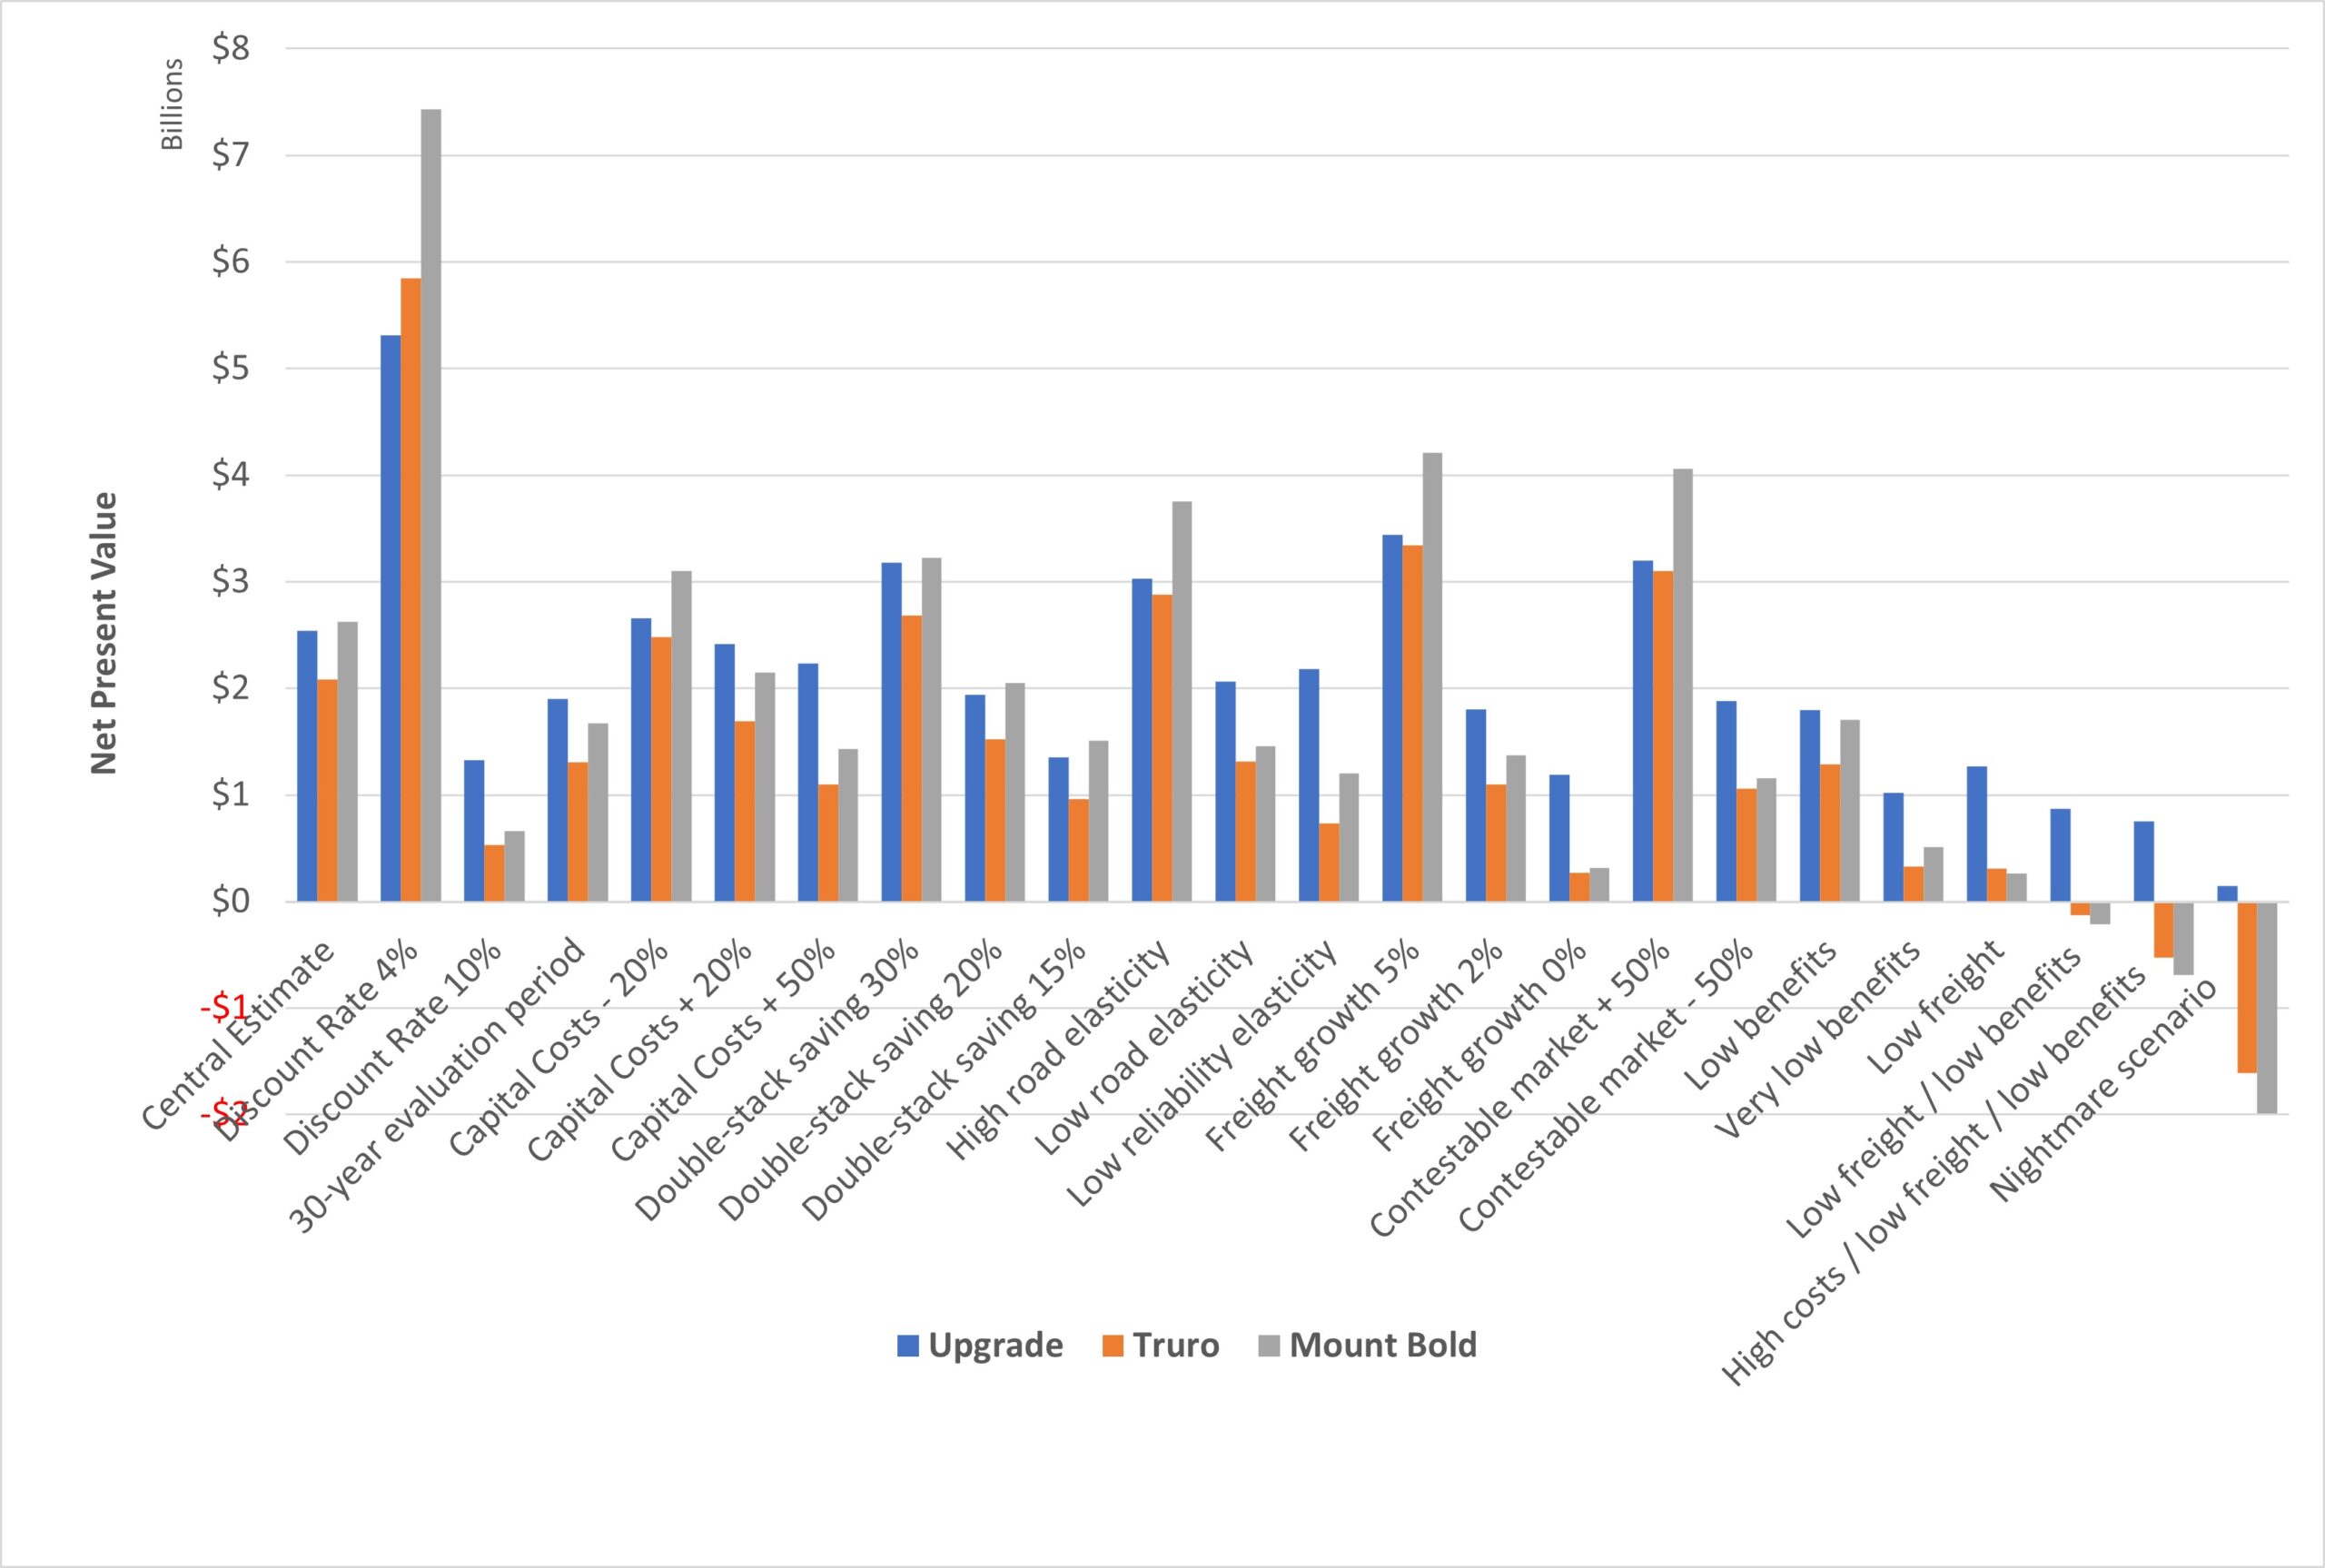
Sensitivity Tests and Discussion
A number of sensitivity tests were conducted by modifying model parameters to observe the effect on the economic performance of each of the options. The model is fully cross-linked such that a change in any parameter flows through to affect all dependent benefits, for example, changing the elasticity of demand of road freight not only affects operating cost savings for freight customers, but also externalities, and freeway benefits.
The sensitivity test scenarios fell into five broad categories, which we discuss individually below.
Discount rate – Benefits are highly sensitive to the applied discount rate, ie, the effective cost of capital. This reflects the heavily future-weighted nature of the benefits. Applying a low discount rate reveals the significant superiority of the Mount Bold route in absolute long-term benefits. However, a high discount rate favours the Upgrade option, due to its short lead-time and significantly lower capital cost. As the world is arguably moving towards a period of higher costs for capital, this would suggest delaying construction until more favourable macroeconomic conditions return.
Capital costs – Project viability was only moderately sensetive to capital costs, with all options retaining a positive NPV even at double the estimated costs. What this test did highlight was the relative risk of each option, with Upgrade overtaking Mount Bold as the preferred option even with only moderately elevated CapEx (+20%). This is particularly relevant given the recent trend of significant cost blow-outs in major infrastructure projects.
Benefits – Modifying the magnitude of double stacking benefit, or the elasticities of demand, affects both the OpEx benefits, as well as the amount of modal shift and related benefits. The relative position of each option was unaffected by the magnitude of double stacking benefit, but strongly affected by elasticity of demand for road freight – high values drove significant modal shift and heavily favoured the Mount Bold route, while lower values resulted in dramatically reduced modal shift, and consequently favoured the low-CapEx upgrade option.
Freight Estimates – These tests modified the annual rate of freight growth (applicable to both existing and captured freight volumes), or the size of the contestable freight market. Similarly to the “Benefit” scenarios, higher estimates significantly favoured the Mount Bold option, while lower estimates favoured “Upgrade”.
Worst Case Scenarios – Finally, combinations of negative parameters tested the limits of project viability:
- “Low benefits” – 20% double stacking saving, road elasticity 0.3
- “Very low benefits” – 15% double stacking saving, road elasticity 0.2
- “Low freight” – 2% growth, -50% contestable market
- “Low freight & benefits” – (1) and (3) combined
- “High cost, low freight & benefits” – (1) and (3) combined, with CapEx +20%
- “Nightmare scenario” – (2) and (3) combined, with CapEx +50%
In each of the “worst case” scenarios, “Upgrade” was the preferred option, remaining at least marginally positive under even the most pessimistic scenarios. Both bypass options retained a positive NPV under low freight or low benefits in isolation, but not when multiple “worst-case” scenarios were combined.
Note that even the most pessimistic scenario is more favourable than the ARFMS central case; we were able to closely recreate the ARFMS results by setting double stacking saving to 2%, contestable market to 0.0mtpa, and reliability improvements to 0%. We do not consider this to be a plausible scenario.
Discussion of the Options
It can be seen that the Mount Bold route has the highest net-present value in the neutral or optimistic scenarios, and retains a positive NPV in every scenario except the few most pessimistic. Its good performance is driven by simultaneously achieving double-stacking, a shorter route for both Adelaide-bound and through-traffic, and an improved alignment. This delivers strong savings for existing freight customers as well as significant new traffic captured from trucks. It has by far the greatest absolute benefits, especially in a high freight scenario. However its high cost, and consequent sensitivity to low freight capture, could count against its selection. There are also potential operational concerns with operating diesel locomotives in such a long tunnel.
The Upgrade Existing option also performs well; it has the highest BCR under every scenario, and gains an NPV advantage over the Mount Bold option in high-cost or low freight scenarios. This is mainly due to achieving double-stacking at low cost, however it fails to attract significant volumes of modal shift due to retaining the existing, slow alignment. It is nevertheless worthy of consideration by a budget-constrained government, and is by far the lowest-risk of the options under investigation. On the other hand, the absolute magnitude of future benefits is lowest under this option, which may limit its strategic desirability for the future of the Australian rail freight network.
The Truro route performs poorly in comparison to other options under all scenarios; it is disadvantaged by its longer route distance (severely so for MEL-ADL freight) and consequently lower modal capture. Even where it performs well, the other options perform better; any parameter which benefits the Truro route (for example, increased double-stacking saving) also benefits the other options to an equal or greater degree. Truro’s externality advantage in removing rail freight from urban areas is far too small to offset its smaller capture of road freight. It is therefore hard to make an argument in favour of the Truro route, in the absence of a compelling strategic imperative to remove freight entirely from suburban Adelaide and the Hills.
| Existing | Upgrade | Truro | Mount Bold | |
| Double stack | No | Yes | Yes | Yes |
| Train length | 1800m | 1800m | 1800m | 1800m |
| Distance | Same | Same | +54km* | -8km |
| Gradient^ | 2.4% | 2.4% | 1% | 1% |
| Time saved | None | None | 1.6hr | 1.8hr |
| Mode Shift | None | 1.1mtpa | 2.0mtpa | 3.0mtpa |
| Passenger use | None | None | Partial | Yes |
| Noise reduction | None | None | High | Moderate |
| Capital cost | None | Low | High | Highest |
Further possible benefits
In addition to the benefits we have considered above, there are a number of additional benefits that we have not considered, many of which could be of a magnitude sufficient to materially affect the project’s viability. Some of these additional benefits would be relevant to all options, while others would only be relevant to a full bypass route that removed freight from the Adelaide Hills entirely:
- Induced freight
- Residential development / urban consolidation opportunities
- Transport equity / access to job markets
- Strategic value to the wider rail network
- Passenger rail benefits
- Major accident mitigation on the SEF
- General productivity improvements
- Residual value
Of these, the potential benefits of fast passenger rail offer the most intriguing possibilities, and could provide an important political imperative for the communities most affected. While the Truro route could allow re-purposing of the existing track for passenger use, the Mount Bold route would itself be a high-quality passenger route (capable of 160km/h), servicing population centres in Mount Barker, Strathalbyn and Murray Bridge. We estimate the economic benefits of such a service to be in the order of $0.9-1.1 billion over 50 years, a figure that could be significantly higher if development were encouraged in the serviced areas.
Urban development presents another interesting possibility, especially for the Truro route, which would completely remove freight from suburban Adelaide. In particular, the large stabling and administrative precinct at Keswick would become surplus to requirements and would be ideally suited to urban renewal. This 18ha (45 acre) site would be the largest inner-city land release in recent years, significantly larger than the 10ha Clipsal site at Bowden. At recent prices, the site might be expected to fetch $150-$200m at auction, in addition to the down-stream benefits of urban agglomeration and densification.
Conclusion and future work
If there is one key takeaway from this review, it’s that the validity of any study hinges on its assumptions. So, what assumptions are more reasonable?
- Should we consider a study area from Murray Bridge to Two Wells, or Melbourne to Perth?
- Should we expect zero modal shift from road and sea, or non-zero?
- Should we evaluate just 18 years of operation, or 50 years?
These three questions form the core difference between the overwhelmingly negative economic case made by the ARFMS, and the emphatically positive case proposed by our review. There can be debate about the precise figures, but the overarching conclusion is clear: the Adelaide Hills rail upgrade is a project of national significance. Far from being a “white elephant”, it merits priority in our national discourse. There is now an imperative for Infrastructure Australia to revisit the ARFMS with a comprehensive feasibility study, refine demand estimates, update risk-adjusted costs and benefits, and determine which of the proposed options – or an entirely different one – will best suit the nation into the future. If the necessary feasibility and design work is conducted with urgency, construction could commence after the completion of Inland Rail, towards the end of this decade or early in the next.
In particular, one option overlooked by the ARFMS deserves more detailed scrutiny – namely, a major enhancement to the existing alignment. This option was favored by the majority of freight operators, as indicated by their submissions to the ARFMS public consultation and their contributions to subsequent studies. Our economic analysis reveals that most benefits derive from 1) double stacking, which is largely route-independent, and 2) road-to-rail modal shift, contingent on an efficient route to Adelaide. This suggests that an “enhance existing” option, which improved curvature but perhaps not gradient, could deliver benefits comparable with the Mount Bold option at substantially lower capital cost. Such an option would likely be a clear standout.
If this work were done in concert with the current State government’s Mount Barker / Adelaide Hills Transport Strategy, the benefits of extending passenger rail to Mount Barker could also be incorporated, transforming the Hills Bypass into a unified project delivering a 21st-century freight and passenger rail network in the Adelaide Hills. This would not only be significant for the national freight network but also put South Australia at the forefront of transit-oriented development, and potentially lay the foundation for a future high-speed connection to Victoria and beyond.
It’s never too late to correct an error, but for practical purposes time may be running out. If the Adelaide Hills route loses further market share to the Parkes route upon the completion of Inland Rail, the misperception of it as an unimportant part of the network will only become more entrenched. It could well be now or never. When properly corrected, the ARFMS may yet serve as the necessary justification to kick-start this critical national infrastructure project.
Header image: Pacific National: Media Gallery
There are some factors not mentioned.
Politics
Transport Minister Tom Koutsantonis as Transport Minister both roles in Opposition and now in Government has stated publicly he would only support rail solutions that involved Adelaide and would therefore not support the Northern route.
Unfortunately his Chief Advisor is Evan Knapp former CEO of SA Freight Council and a road stalwart and the driving force for the heavy transport tunnel.
ARTC
In 2021 ARTC made a submission to Infrastructure Australia for the Melb-Adel rail line, no details are available to the public and can only assume to be track upgrades.
Increased Rail Freight
I have been communicating with a business group in Western Victoria and the Mallee and have been assured that a number of clients want to transport freight to Adelaide as this is a shorter route in time and distance than Geelong and Melbourne, with the advantage of a 24 hr turn around compared to the other alternative.
Hi Edwin.
Have you heard of Dr Paul Szuster and his Adelaide Hills – Rail Tunnel Scoping Study proposed in Aug 2021?
I think it may have merit but like every infrastructure project must pass the economic criteria first.
https://www.linkedin.com/pulse/adelaide-hills-rail-tunnel-scoping-study-dr-paul-szuster
Hi Dave, yes I’m aware for Dr Szuster’s proposal. A tunnel to Nairne would be perhaps twice the length of the Mount Bold tunnel. There would be additional benefits in both the passenger service and the shorter route, but I doubt they would be of sufficient magnitude to justify the much higher construction costs. There would also be operational issues with diesel operation in such a long tunnel – over twice as long as the longest comparable tunnel in the world! Certainly, a proper study should look at all potential routes, but I’d be surprised if this ended up being the best option.