


A recent article by Cosmos Magazine contained an eye-catching statistic: in the twelve months to June 2023, The Overland carried over 23,500 passengers on its 11-hour run between Adelaide and Melbourne. This may not sound that impressive in and of itself, but it’s a big increase on the pre-pandemic low of 17,000 reached in 2019 – almost 40% higher! Although it’s still well below historical levels, this is the first significant increase in ridership in the quarter-century since privatisation.
This encouraging fact inspired me to reconstruct a ridership history for The Overland – a task that turned out to be far more challenging than I initially assumed. It’s involved dozens of different sources, including annual reports of Australian National, the South Australian Railways and Commonwealth Railways, subsidy audits, news reports and others, as well as many hours in the State Library poring through as-yet undigitised physical reports. I am therefore pleased to present the first complete annual ridership history of The Overland, from its 1970s heyday to the present day:
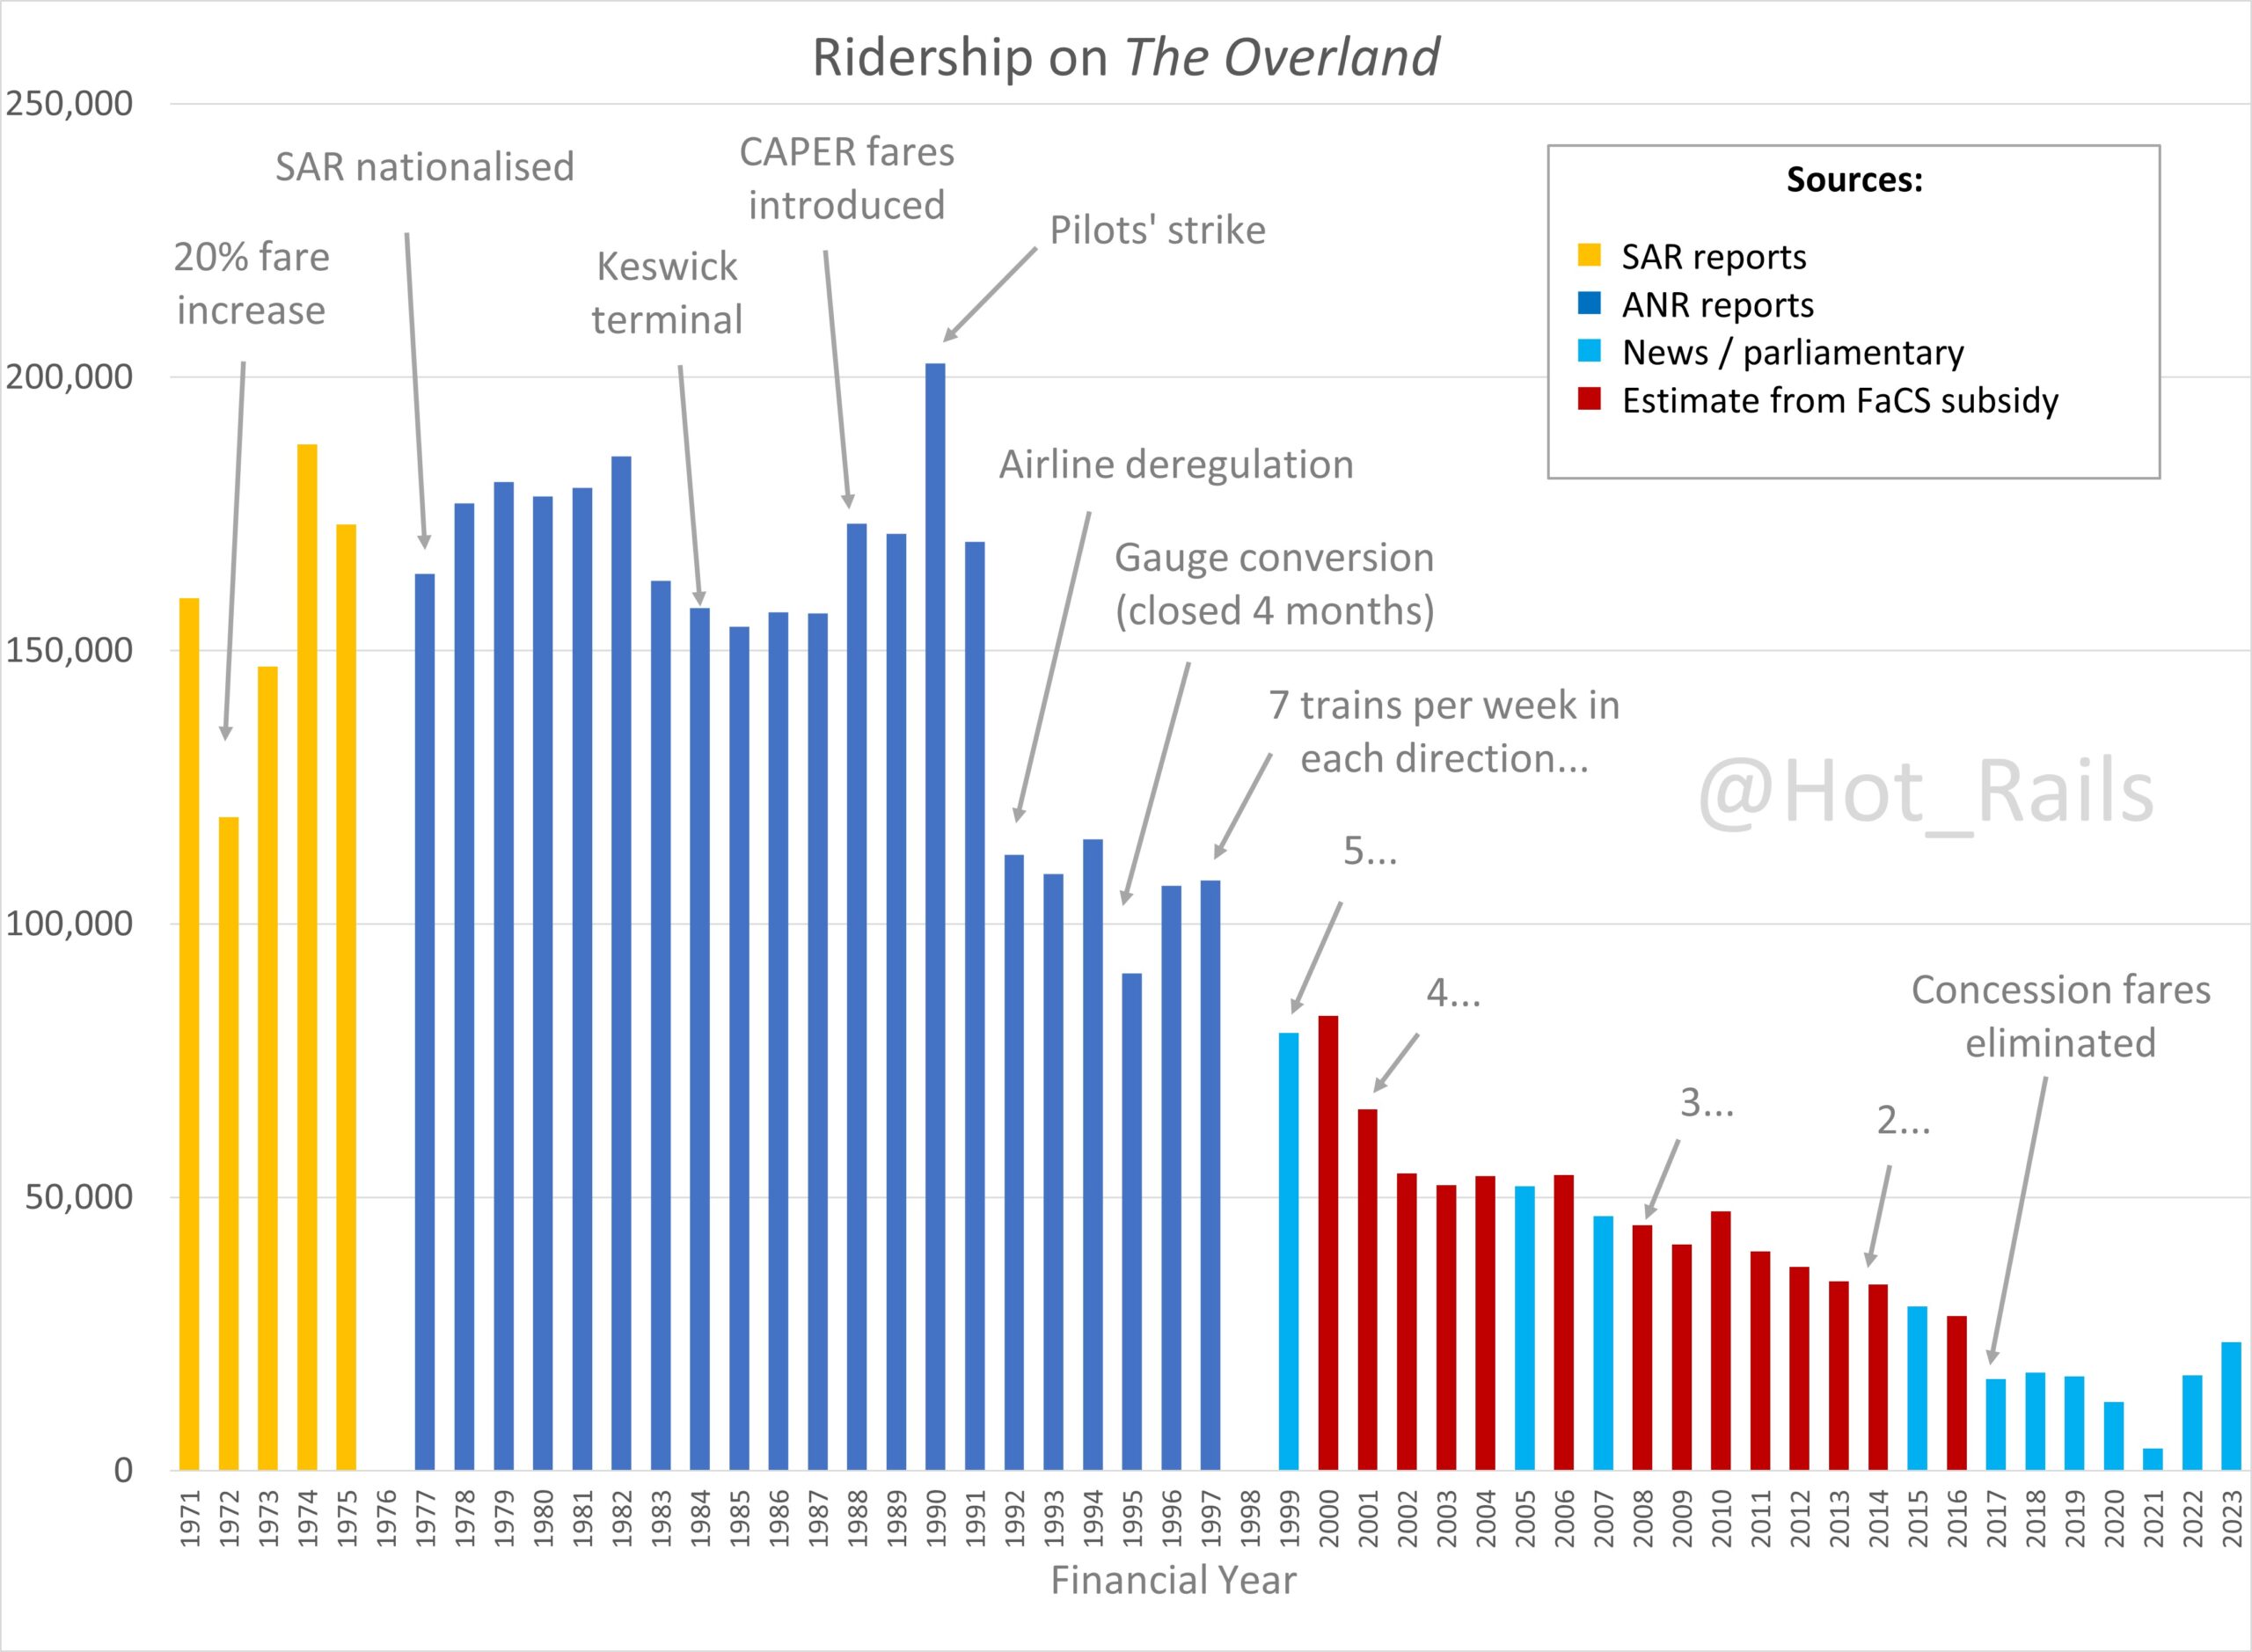
Here’s where the data came from:
Australian National era
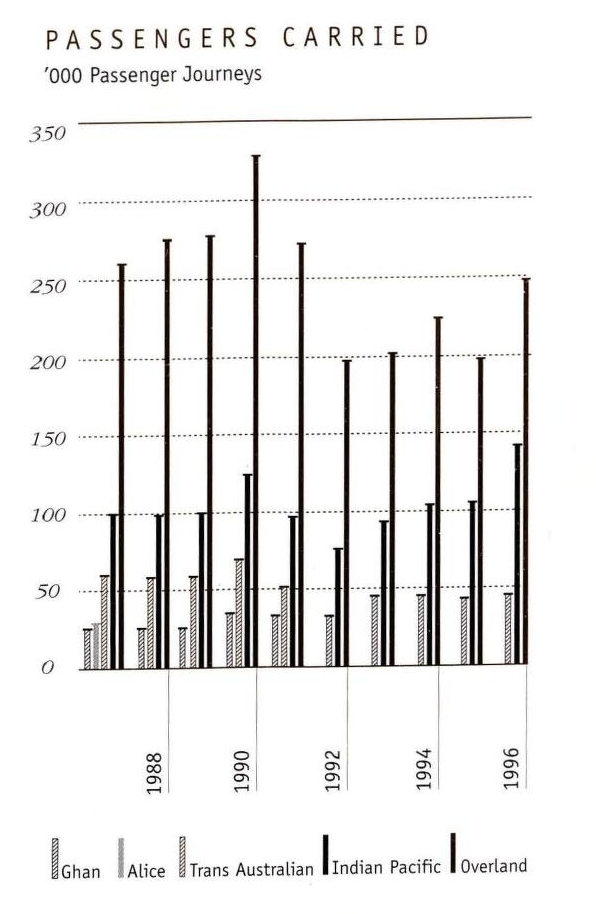
The obvious place to start is with the years 1977-1997, when the train was operated by Australian National. AN published yearly ridership statistics for The Overland, The Ghan and the Indian Pacific directly in its annual reports, which are viewable online via Trove. From 1995, the annual report presented the data in a graphical bar chart form, rather than the previous numerical table. Furthermore, in ’96 and ’97, the data is erroneously presented as a clustered rather than a stacked column chart (ie, in 1996 The Overland’s ridership is presented as 249,000, when this should be the total for all three rail services – the actual ridership in that year can be graphically estimated at 107,000).
This gives us a solid base to work from – reliable annual data for a good two decades, encompassing some of The Overland‘s best years. However it leaves out the crucial final years of the SAR from the early 1970s, as well as the final decline in the privatised era of the late 1990s and 2000s, when the frequency was progressively cut from daily to the present twice-per-week. Thankfully, there’s data we can work with for these eras as well. Let’s start first with the SAR era.
South Australian Railways era
The Overland has almost a century of history prior to the nationalisation of the SAR in 1975. Unfortunately, it’s difficult to find any sources from this era that explicitly mention the Overland’s annual ridership. The latest of the South Australian Railways Commissioner’s annual reports give ridership numbers summarised by “suburban, country and interstate”, but before 1971 “country and interstate” were combined, and before 1957, only a network-wide total was given. There may be some primary sources that still exist, presumably filed somewhere deep in the undigitised archives of State Records, but none that are easily accessible to an amateur historian such as myself.
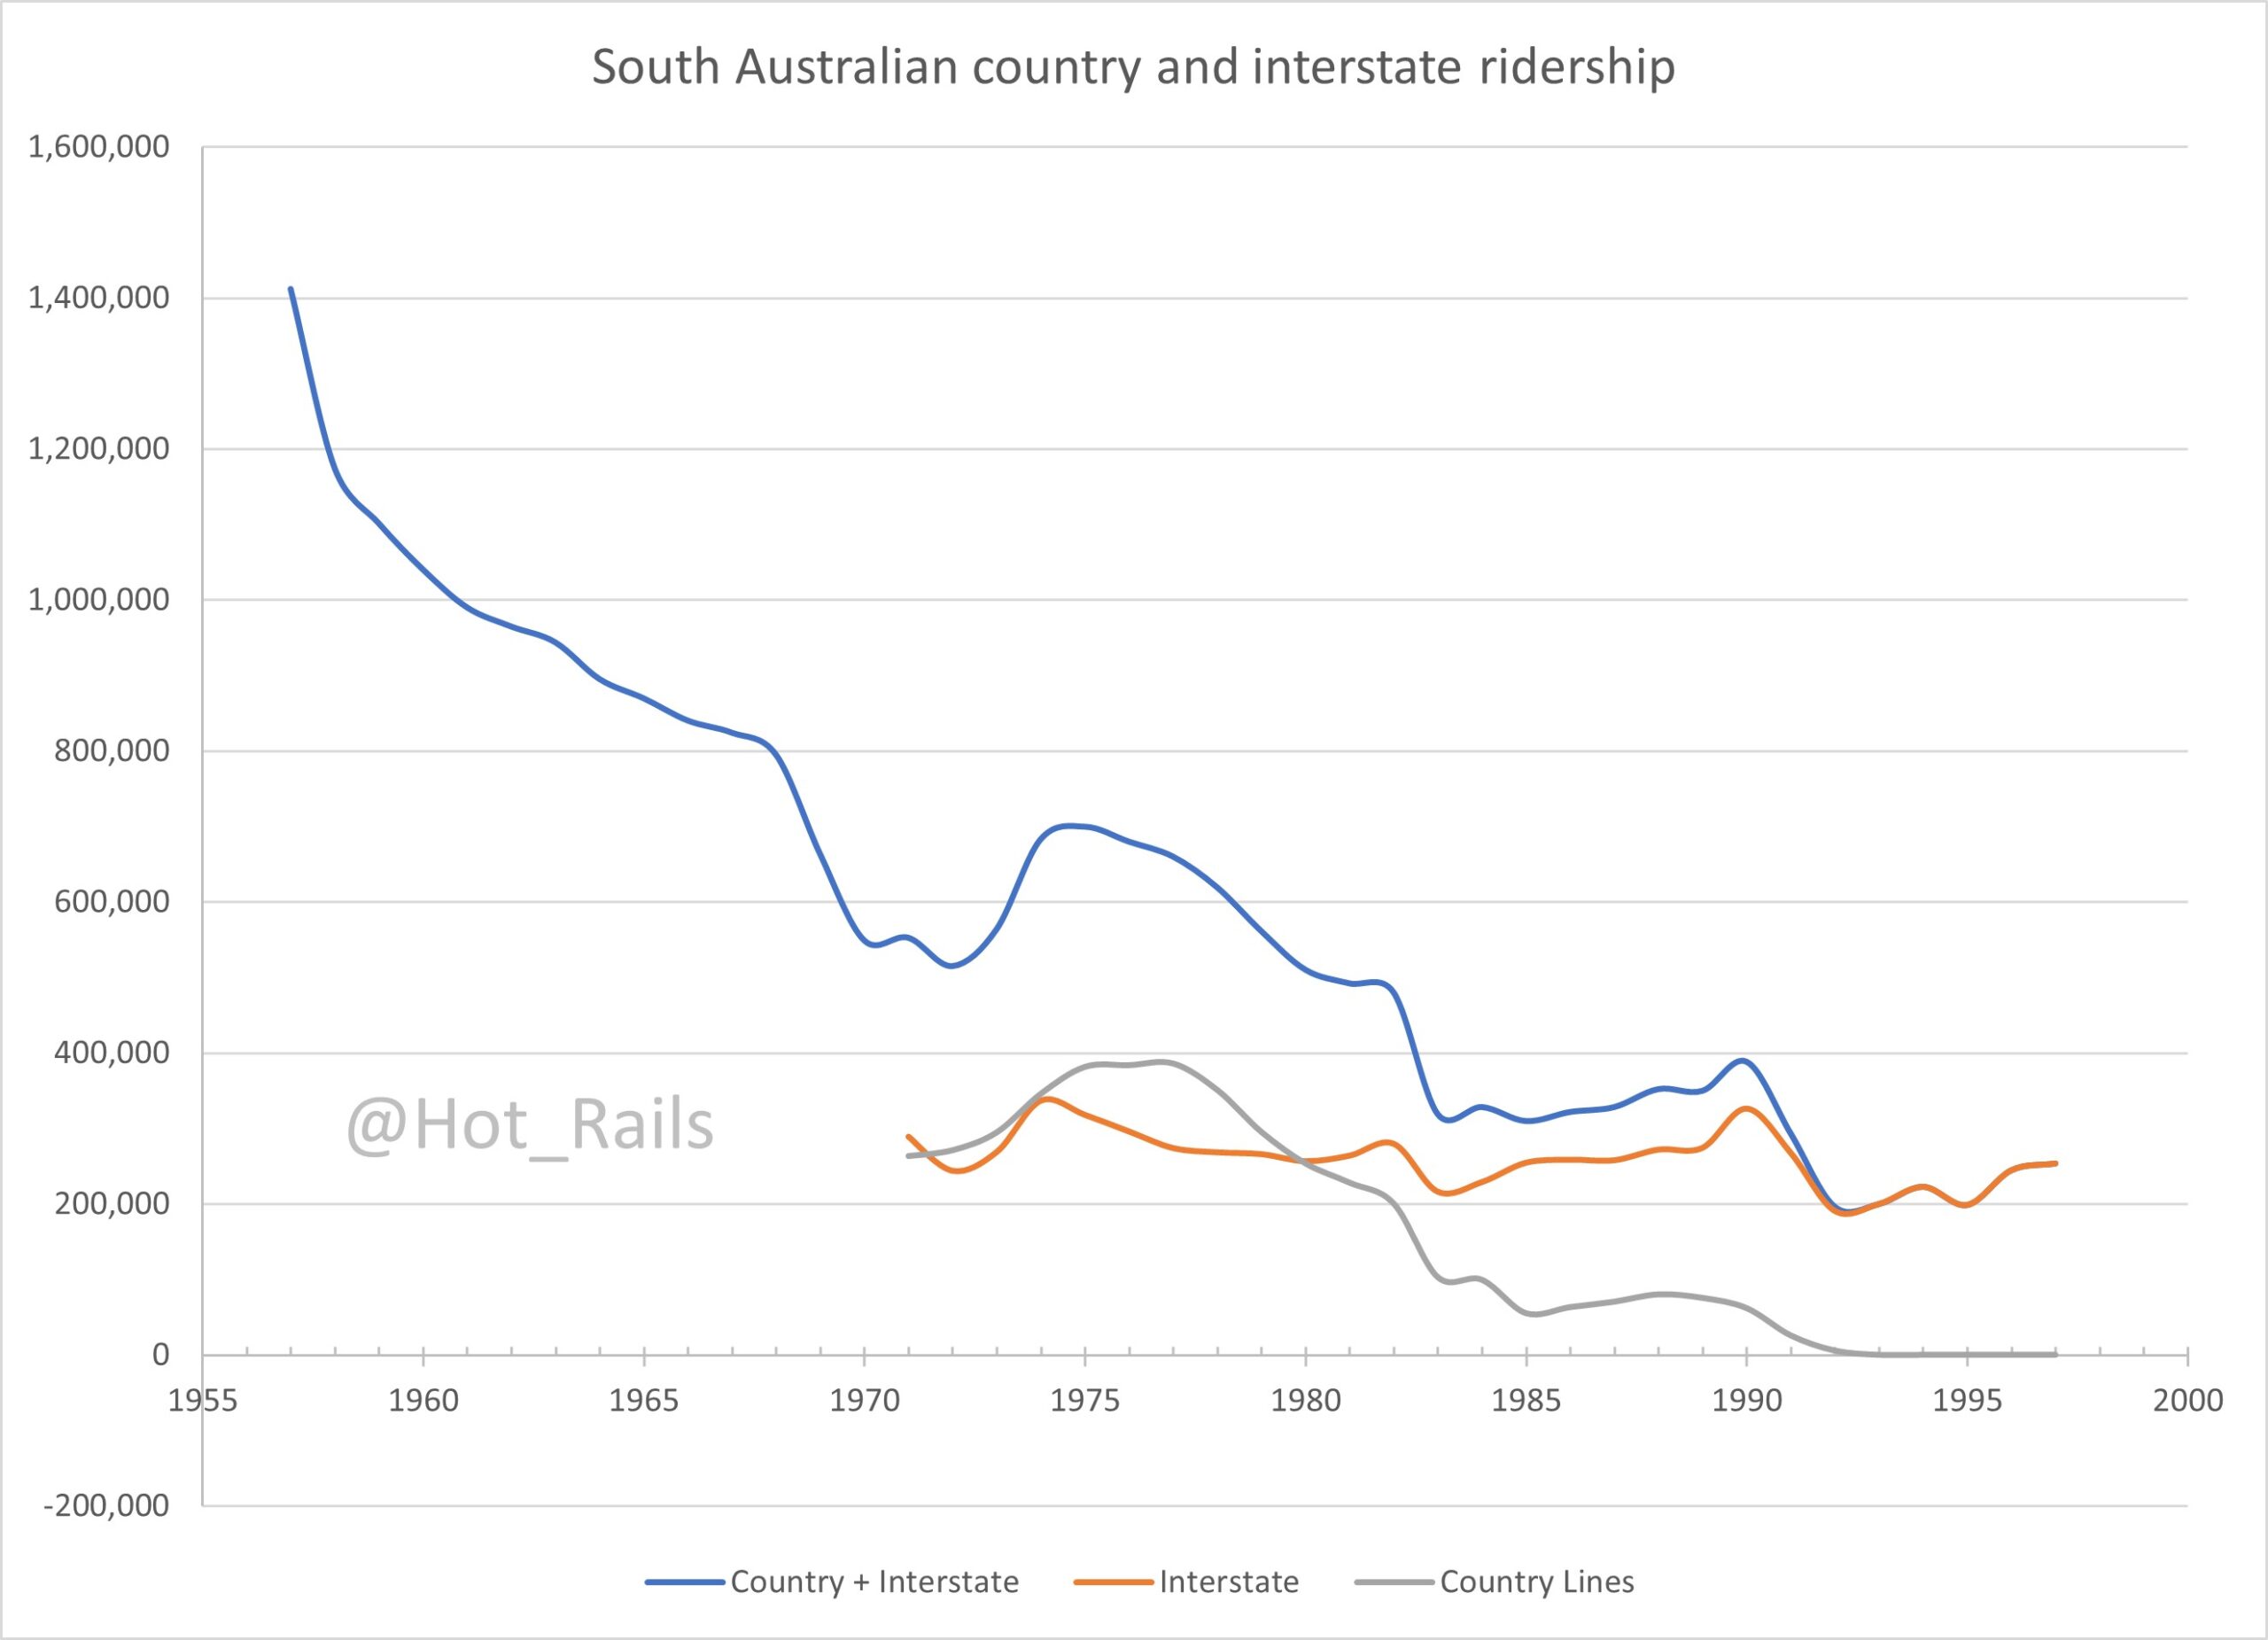
The post-1971 numbers at least give us a separate “interstate” category; the figures range from 244,000 to 337,000 per annum – double The Overland’s post-1975 ridership. What would be included in this? At the time, interstate passenger trains from South Australia included The Overland, The Ghan, the Trans-Australian, and the Indian Pacific. However of these, only The Overland and the Indian Pacific were operated by the SAR (and even then only jointly). The Ghan and the Trans-Australian were wholly operated by Commonwealth Railways. This is further complicated by the fact that the Trans Australian and Indian Pacific were sometimes run as a combined consist, and still further in that, in 1973 and ’74, the SAR was responsible for one, and subsequently two, of the seven weekly Trans-Australian services (the SAR’s final 1975 report explicitly credits the surge in “interstate” ridership to this factor, in addition to improved Overland patronage).
While Commonwealth Railways reported only a total ridership for the Trans Australian and Indian Pacific combined, we find the ridership of each train individually in this 1977 report by the Bureau of Transport Economics (the split is almost exactly proportional to the number of weekly trains). If we deduct just those intersystem passengers that rode SAR-provided services from the SAR “Interstate” figures, Overland ridership peaks at about 270,000 in 1974 – an average of 370 passengers per train, which seems implausibly high (this would have necessitated a typical consist of perhaps 16 carriages or more – a not-unknown number, but certainly not typical). If however we deduct all intersystem passengers (TA, IP and Ghan), the 1974 peak is reduced to 189,000, or 259 passengers per train – a much more reasonable number.
If we were to take the higher estimate, then we would observe a significant drop in passengers of almost 35% in 1977. It is not clear what could have caused such a severe and sudden drop, as both the frequency and fare level were unchanged over this era. Furthermore, no contemporary sources refer to any such sudden drop – quite the contrary, demand for The Overland is frequently described as strong or improving. For this reason, the lower estimate which shows ridership at roughly the same level as later in the 1970s is considered the more plausible (though we would admittedly prefer some more solid confirmation of this).
Pre-1970s
Sources from the 1970s and earlier consistently indicate between 200-300 passengers and usually 8-12 carriages per train (a reasonable proxy for ridership given the variable consist). As we know the frequency was fixed at one train per day in each direction, that means we can multiply the typical occupancy by 730 to approximate the annual ridership. We also have a pretty good idea of the typical consist, and we know capacity factor was typically high due to building the consist up and down to meet demand, therefore ridership can also be approximated by number of carriages, albeit very roughly. We won’t include this in our chart, but it’s good background knowledge, suggesting the Overland’s ridership was pretty stable for at least several decades prior.
- 10 March 1975 – the westbound Overland derailed at Monteith, near Murray Bridge; 17 people were injured and 10 carriages were damaged.
- 11 February 1973 – this photo by John Beckhaus shows The Overland at Ingliston Bank with at least 14 carriages (we can’t see how many carriages are behind the one that the photo is taken from) – this is a pretty large consist, probably indicating well over 300 passengers.
- 30 August 1971 – the westbound Overland derailed at Bungaree, Victoria, with a reported 330 passengers aboard (this would be 240,000 people per year – consistent with the higher estimate). The Canberra Times reported that 12 carriages derailed.
- 10 May 1970 – a goods train derailed west of Ballarat, forcing “about 300” passengers from the eastbound Overland to complete their journey by bus (219,000/year)
- This Bureau of Transport Economics report proposes a linear regression formula for Overland ridership, which suggests that patronage was 238,488 in 1968, but falling at around 3% annually – broadly supportive of the numbers we’ve estimated for the early 1970s. As this formula was based on real monthly data from Victorian Railways, we’ll take the 1968 number as an actual patronage figure.
- 14 January 1955 – the last four cars of the eastbound Overland (comprising 12 cars in total) derailed near Sunshine.
- 14 September 1953 – a goods train derailment at Kiata forced the Overland to detour via Mount Gambier and Hamilton, with “almost 200” weary passengers reaching Spencer Street nine hours late.
- 7 September 1951 – the westbound Overland collided with the stationary eastbound train at Serviceton, killing one fireman. Most reports put the total number of passengers for the two trains around 600, with each train comprising 12 carriages.
- The State Library of South Australia has many Overland images from the 1950s, which consistently show between 9 and 13 passenger carriages, which would be consistent with 250-300 passengers per train (180,000-220,000/year).
- The December 1956 edition of Meccano Magazine describes the typical train as being built up to a typical capacity of 350 passengers – this implies a 13-car consist comprising 1 first-class sitter, 2 second-class sitters, 1 second-class/cafeteria car, 6 sleepers, 1 club car, and one brake-van.
Great Southern Rail era
Returning to the 1990s, “Pax Rail” (the arm of AN that operated The Overland, The Ghan and Indian Pacific), was privatised in November 1997 and became Great Southern Rail, a privately-owned consortium in which the British multinational Serco held a majority interest. The $16 million sale included 139 passenger carriages, as well as the Keswick and Alice Springs terminals. At that time (FY1997), total ridership on the three GSR services was 254,000 people per year, comprising 108,000 on The Overland, 105,000 on the Indian-Pacific, and 41,000 on The Ghan.
As a private company, GSR were under no obligation to publicly release any ridership statistics. Nevertheless, over their 19 years of ownership there were a few instances where such statistics were reported:
- In July 1999, Great Southern Rail CEO Stephen Bradford addressed a South Australian parliamentary committee, stating that The Overland’s ridership was then “about 80,000”.
- In May 2006, GSR made a submission to the federal Productivity Commission review into road and rail freight pricing, documenting 2005 ridership numbers of 52,000 for The Overland, 74,000 for The Ghan, and 79,000 for the Indian Pacific.
- In a March 2016 press release related to the sale to Allegro Funds, GSR’s chief executive officer Chris Tallent claimed an annual ridership of “almost 30,000“; we can presume this refers to 2015, as the 2016 numbers would not have been available at that time. Transport minister Stephen Knoll also referred to passenger numbers having collapsed by “a factor of 3” over 15 years, which broadly supports this figure.
These three datapoints, roughtly located at the start, middle and end of the GSR era, demonstrate the broad trend, with ridership collapsing by a factor of three over 18 years – but it sure would be nice to fill in those big gaps. Thankfully, there is another measure we can use – the federal government subsidy. Unlike the state subsidies, which were and continue to be lump sums, the federal subsidy was based on usage, meaning that with a bit of number crunching, we can use it as a proxy for total ridership.
The FaCS Subsidy
The privatisation deal was subject to the ongoing provision of concessional tickets for pensioners and veterans; this was supported by a federal subsidy administered by the Department of Family and Community Services (FaCS), whose annual reports are archived by Trove, here. These reports detailed not only the dollar amount, but also the number of eligible “clients” making use of that subsidy, as well as the total number of trips taken under the program:
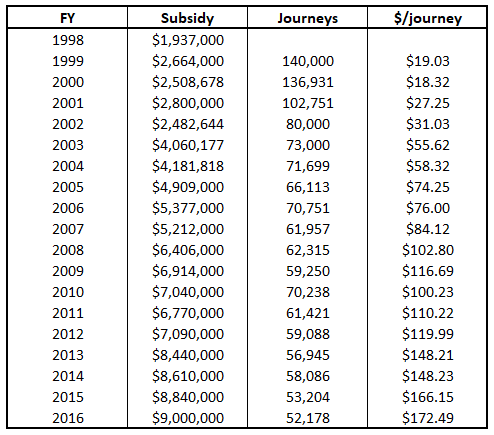
The data here isn’t perfect; the Trove archive linked above only goes back to 2001; the 2000 and 1999 reports are available here, while a 2005 Auditor General’s report gives the subsidy amount – but not usage – for 1998. In 2001, ’02 and ’05, the report gives number of clients but not individual journeys. From 1998-2003, the 2005 audit notes there is “some confusion” about whether the reported usage refers to clients or individual journeys; we have resolved this confusion on the assumption that the clear post-2003 trends in both overall trips, and trips per client, were broadly similar during this earlier period.
The years where we have actual Overland ridership (’99, ’05 and ’15) allow us to calculate a conversion factor from subsidised journeys (over all three services – Overland, Ghan and Indian Pacific) to total Overland journeys. We then use linear interpolation to estimate the value of this conversion factor for the intervening years. While this method is imperfect, it implies a reasonable total percentage of concession trips, as well as the Overland’s percentage of total GSR trips. Furthermore, the years with actual data happen to nearly-coincide with plausible inflection points – the initial reduction in frequency in 1999, the significant increase in Ghan traffic following the opening of the Alice Springs-Darwin railway in 2004, and the end of the GSR era in 2016.
*UPDATE June 2024* – The 1998 figure comes from the 1997/98 Department of Transport and Regional Development annual report, which makes clear that the figure refers to the first four months of FY98 (up until 31 October 1997, when the new subsidy agreement began) and not subsequently (annualised over 12 months, the figure would match the pre-existing subsidy level of around $5.5m/annum). We’ll discuss this further at the end of this article.
Private Equity era (2016-present)
By the mid-2010s, GSR’s business model had been severely disrupted by the rise of low-cost airlines, and ridership had fallen off a cliff. With frequencies cut to twice per week for The Overland and just once for The Ghan and Indian Pacific, the business was entirely reliant on a combination of state and federal subsidies, the latter of which had grown to $8.5 million per annum by 2013, with the total subsidy per journey soaring above $200. When the discontinuation of this subsidy was announced in 2014, Serco immediately announced their intention to sell the business, which was no longer profitable.
In early 2015, the Australian private equity fund Allegro backed a management buyout of Serco as owners of GSR. The full terms of the sale have not been publicly revealed, but it was undoubtedly at a knockdown price, variously reported as “below A$20 million” (The AFR) to as low as £2.5 million (as reported by Railway Technology, supported by The Advertiser, who reported a cash-component price of $5 million). The Ghan and the Indian Pacific were reinvented as luxury rail cruises, making solid profits. After just 18 months, Allegro sold GSR to another PE fund, Quadrant, for an undisclosed sum but reportedly tripling their money.
The Overland, with its shorter duration, was not suitable to such a luxury rebranding. The Victorian and South Australian governments reluctantly continued to provide a flat annual subsidy totaling about $4 million per year (originally $3.45m from the Victorians, and $330,000 from SA) to ensure the survival of the service. Each agreement lasted three or four years, giving us a fairly reliable cadence of debate over the service’s future, occasionally resulting in more patronage data being reported:
- October 2019 – The Australian noted the decline in patronage over the previous decade, citing a figure of 46,553 in 2007, down to 18,737 in 2017 (it is comforting to note that the 2007 figure differs from the estimate made using FaCS subsidy data by less than 2%)
- January 2020 – The Wimmera Mail Times reported “steady” Overland patronage for the previous 3 financial years (FY17 – 16,771; FY18 – 17,965; FY19 – 17,254) – the difference in the 2017 figure to that provided by The Australian is explained by the non-inclusion of V/Line codeshare fares in the latter data, which were added as a condition of the Victorian state government subsidy in 2016.
- July 2023 – In announcing the renewal of South Australia’s subsidy for The Overland, the Department of Infrastructure and Transport reported 2022 patronage at 17,388, and “just over 4,000” for 2021 (the majority of which was affected by the COVID lockdowns in Melbourne).
Lockdown era
While we have found no source that directly reports patronage for FY2020, we can make a reasonable estimate by assuming 1) that annualised ridership remained constant, and 2), that ridership is constant throughout the year. We can therefore estimate annual ridership based on the known dates that the service was suspended due to COVID.
Journey Beyond initially suspended The Overland, The Ghan and the Indian Pacific on 23 March, 2020, and they remained suspended for the duration of the financial year. 23 March to 30 June is 100 days, so we would estimate the FY2020 patronage proportionally at 265/365 * 17,254 = 12,500 (approx).
Likewise in FY2021, The Overland was suspended from 1 July 2020 to 3 January 2021, and a further week for the snap-lockdown in February, making a total of 194 days suspended, or 53% of the year. The lower-than-proportional ridership (4,000 being just 22% of the pre-COVID ridership) can be explained by reduced interstate and international travel as well as consumer reluctance to travel during the initial post-COVID recovery.
FY2022 is interesting, because the reported ridership was back up to pre-pandemic levels, despite the service being suspended for 133 days, or 36% of the year; this indicates an annualised patronage equivalent to about 25,000 – similar to the reported figure for FY2023. This strong resumption of demand probably reflects the lower frequency and higher fares of airline service in the initial post-pandemic period.
Suspension timeline:
- 23 March 2020 – Overland, Ghan and Indian Pacific suspended
- 3 January 2021 – The Overland resumed
- 12 February 2021 – The Overland cancelled for a week due to a snap, 5-day lockdown.
- 9 June 2021 – The Overland was replaced by a coach service, with the same schedule and stops, resuming standard rail service from July 7.
- 16 July 2021 – Fifth Victorian lockdown results in another suspension of The Overland.
- 26 November 2021 – Coach replacement service resumes, with normal train service resuming on 12 December.
Discussion
- The most striking features of the graph are:
- Fairly rapid rise in the early 1970s to a 15-year sustained plateau until 1991 – this coincided with a period of fairly aggressive price competition with airlines, in which the effect of fare changes is clearly evident (eg from 1972, rail fares were held constant for several years, resulting in significant patronage switching from airlines)
- There is a dramatic drop from 1991-1992 – not a gradual reduction over several years, but a sudden change from a plateau at ~160,000, to a lower plateau at ~100,000. Likely a direct result of airline deregulation, which resulted in a sustained ~22% drop in airfares in the first years of the 1990s.
- We see pretty clear step-drops in 1999, 2000 and 2007, which clearly map to the reductions in service frequency in the same years.
- The peak in FY1990 coincided with the Pilots’ Strike, which began in August 1989 and continued into 1990.
- The dip in 1995 numbers reflects the four-month suspension of the service while the Adelaide-Melbourne railway was gauge-converted (the last broad-gauge Overland departed on March 1, while the first standard-gauge Overland departed on July 1). Interestingly the year-on-year drop (21%) was significantly less than proportional to the suspension duration (a third of the year).
We are left with just one missing data point between 1971 and 2023, and annoyingly it’s a critical transition year – 1998, immediately following the takeover by GSR, and before the reduction in frequency from 7 days per week to 5. We can make a reasonable estimate of the patronage by comparing to passenger revenue, as there were no dramatic changes in the patronage of The Ghan and Indian Pacific over this period.
In 1998, the Australian National Railways reported $19.93 million in passenger ticket revenue up until the 31 October 1997 sale date, which is an annualised increase of 11.4% over the previous year. Similarly, the annualised subsidy shows an increase of 7.6%. It is therefore evident that patronage for the first four months of FY98 was an increase on the 1997 figure. But by how much? Economy fares increased by about 7.4% over the same period, which means patronage must have increased 3.7% to produce the observed ticket revenue. As fares were maintained at the same level subsequent to 31 October, we can reasonably extrapolate this increase to the remainder of the financial year, putting 1998 patronage at about 112,000.
Read the article and it’s a good improvement considering the limitations of the service, but with a direct two way daily service passenger numbers would increase. I have been following Brightline in Florida and the success they are achieving.