


In September 1975, nearly a decade before the CSIRO’s famous white paper that eventually became the Very Fast Train Joint Venture, the South Australian Railways quietly released the findings of “Project Peregrine” – a proposal to upgrade the rail corridor between Adelaide and Tailem Bend to a modern, mixed-use fast-freight and passenger railway. Named for the fast-diving bird of prey that makes its home in the Adelaide region, Peregrine is the first known instance of 160km/h linespeeds being specified by an Australian rail agency, which probably makes this the first time a “fast rail” proposal was seriously advanced in Australia.
In this article we review Project Peregrine and the two major economic evaluations of it (from 1977 and 2001), and consider whether the time may be ripe for another look at this ambitious plan. The sections dealing with the economic evaluations go into some detail about the methods and assumptions of those studies, which non-technical readers may wish to skim over. Nevertheless, we have attempted to present our analysis in an accessible format so that readers can follow our reasoning.
Project Peregrine was the brainchild of Geoff Virgo, transport minister in the Don Dunstan state government of 1970-79. The progressive Labor Party government had recently scrapped the controversial MATS plan (an American-style freeway network that would have wrecked the city), and was eager for South Australia to adopt the most up-to-date mass transit technologies. Among several competing proposals was the (even then) long overdue modernisation of the Adelaide Hills rail corridor, one of the steepest and tightest sections of the entire national rail network. The South Australian Railways were tasked with preparing the rail concept, under the direction of the Chief Engineer for Railways, L.H.A. McLean.
The South Australian government was at that time promoting a policy of creating a satellite city at Monarto, which was projected to grow to a population of 65,000 by the year 2000. The existing rail service to the small town was then timetabled at a shade over 2 hours; Peregrine aimed to reduce this to 45 minutes to facilitate commuting between Monarto and Adelaide. Additionally, grade reduction, electrification and track duplication would reduce operating costs and alleviate increasing congestion of the freight route, which was even then one of the major bottlenecks on the national network.
Despite a string of successful social reforms, when it came to infrastructure the Dunstan government developed a reputation for “promising everything and giving nothing”. After their cancellation of MATS in 1971, a succession of experimental mass transit options were considered – among them, “dial-a-bus“, an air-cushioned “hovertrain“, personal rapid transit “pods”, magnetic levitation monorails (of course), and perhaps most bizarrely, automotive fuels derived from cactus juice. This proved a tactical blunder to the idealistic government, providing rich subject matter for mockery by their political opponents. Perhaps in part due to the uncharacteristically evocative name, the relatively conventional Peregrine upgrades were lumped in with the attacks on Minister Virgo’s “flights of fancy”.
Following a negative economic evaluation of the proposal by the Bureau of Transport Economic in 1977, and possibly stung by political criticism of their infrastructure policy, the Dunstan government abandoned Peregrine as a major policy initiative in the late 1970s. Nevertheless, it remained on the drawing board until well into the ARTC era over two decades later.
The Peregrine Options
In order to upgrade the Adelaide Hills railway to modern freight standards, as well as facilitating commuting from Monarto, the following design specifications were adopted for Peregrine:
- Maximum ruling grade: 1%
- Minimum curve radius: 1600 metres
- Minimum structure gauge: 7 metres (double stacked)
- Double track: as far as Monarto
- Track standard: 160 km/h to Monarto, thence 110 km/h
Peregrine proposed three alternate schemes which achieved some or all of these specifications:
- Curve easings – broadly retaining the existing corridor, but straightening curves to the maximum extent possible without major deviations. No gradient reduction, and only partial improvement to curvature and speed.
- Deviations – retaining some of the existing corridor, but with several substantial deviations. Gradient reduction only in the westbound direction, but otherwise meeting the curvature and speed specifications.
- Tunnel – bypassing the most difficult terrain with a very long tunnel, meeting all specifications (or nearly so).
Try as I might, I have been unable to obtain a copy of the original Peregrine report. However, we can make a pretty good estimation of the proposed works and route of each scenario based on secondary sources.
Scheme 1 – Curve Easings
The first scheme presents a relatively conventional, yet still ambitious plan for straightening the severe curvature of the line. No grade reduction was involved, but by daylighting or bypassing the existing tunnels (plus rebuilding other structures), double stacking could be achieved, and improvements to curvature would modestly increase the allowable speed. 27 individual sites were identified between Keswick and Tailem Bend, the most significant of which was a complete rebuild of the line between Nairne and Callington. Each of these projects could be constructed and operated independently of one another, allowing for staged introduction. SAR estimated the cost at $51 million in 1974 dollars ($480m in 2023).
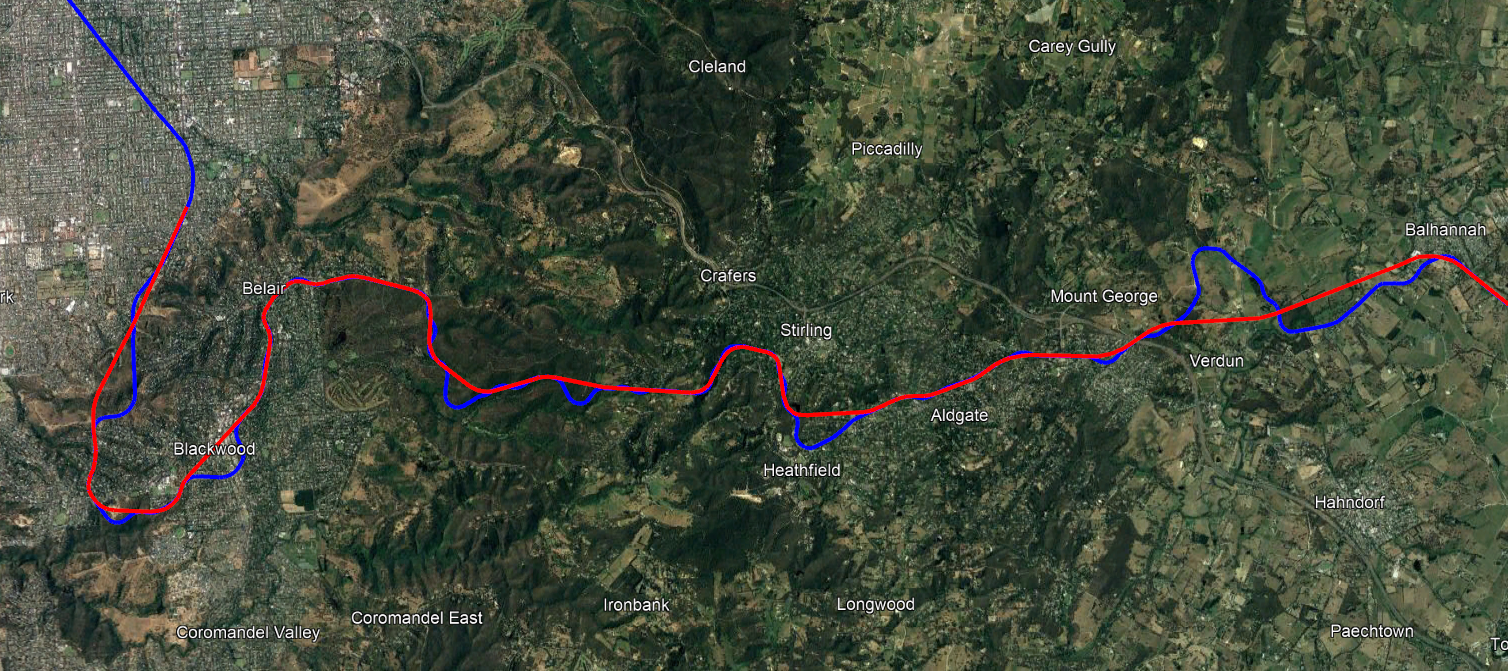
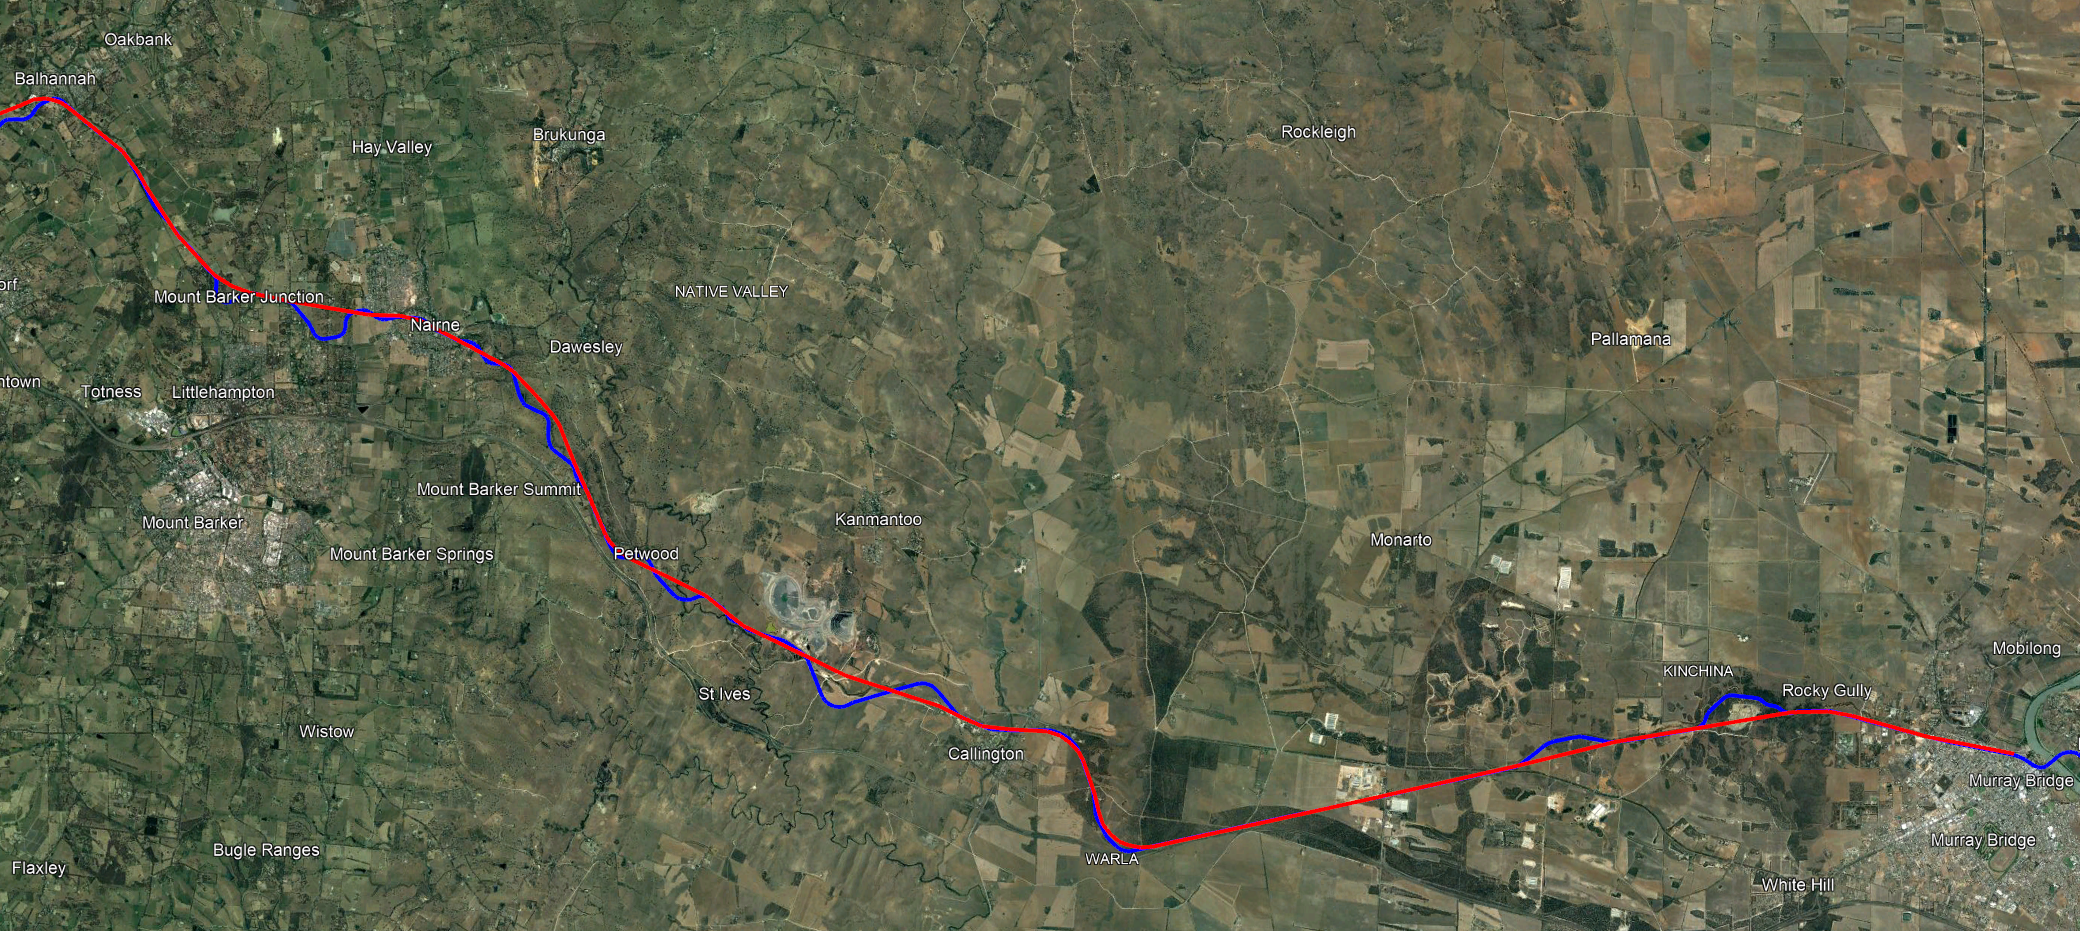
A detailed description of each deviation is reproduced in an appendix of the 2007 Mitcham Rail Freight Task Force report; the following map is based on this description, with the existing line shown in blue, and the Peregrine proposal in red:
Scheme 2 – Deviations
The second option retains 12 of the curve easing sites from Scheme 1, but adds three major deviations to give further improvements to curvature, as well as grade reduction east of Mount Lofty (allowing banking engines to be eliminated for westbound trains). The SAR’s estimated cost was $70 million in 1974 dollars ($659m in 2023). We find a partial description of these deviations in a September 1975 article in Keeping Track:
- Eden Hills to Aldgate – a 14.2km-long deviation, saving 6km. The precise route is not described, but it probably would have been a mostly-surface route through Craigieburn Farm and Coromandel Valley, subsequently following the Sturt River and rejoining the existing track around Heathfield.
- Bridgewater to Callington – Even less detail is offered on this section, except that it would save 2.5km over the existing route (meaning it would have to be about 42km long), would have a 1% ruling gradient, would deviate as far as 6km from the existing route, and would pass within “about 10km” of Strathalbyn. Some of these stated constraints are mutually exclusive; in particular, a 10km radius circle centered on Strathalbyn comes no closer than about 10km to the existing line.
- Warla Bank to Tailem Bend – a nearly-straight 42km bypass of Murray Bridge, saving 8km over the existing track, and incorporating a new bridge west of Tailem Bend.
Scheme 3 – Long tunnel
This is the scenario Peregrine was conceived to avoid – a very long tunnel bored directly from Mitcham to the vicinity of Balhannah, and subsequently an improved railway to Monarto and Murray Bridge (it is unclear whether this refers to the works of Scheme 1 or Scheme 2, but we can probably assume Scheme 2 since the whole point of Scheme 3 is to reduce gradient, which Scheme 1 does not achieve). The tunnel would need to be at least 18km long.
This scenario is not considered in great detail; the main focus of the report is on Scenarios 1 and 2, with Scenario 3 expected to be impractically expensive; SAR estimated $198m in 1974 dollars ($1.86bn in 2023).
The 1977 Mainline Upgrading Report
The Bureau of Transport Economics (BTE) assessed the Peregrine proposals in a 1977 study (Mainline Upgrading – Evaluation of a Range of Options for the Adelaide – Serviceton Rail Link). This was one of a series of investigations into upgrading the railways between all state capitals; it should be read in conjunction with the earlier Melbourne-Serviceton study, in which the supporting assumptions and calculations are explained in far greater detail. All costs in this section are expressed in June 1976 dollars, except where otherwise indicated.
The BTE report considered the three Peregrine scenarios, as well as a more modest proposal to upgrade the line to Centralised Traffic Control (CTC, i.e., automation of the then-manually operated switches). Two methods of evaluation were used: a commercial net revenue method, and a “Total Resource Cost” method; both methods yielded similar results, concluding that the CTC upgrade was viable, but that none of the Peregrine upgrades were. We consider the full-economy approach to be more appropriate, therefore will confine our review to the Total Resource Cost numbers of the BTE report.
Resource Cost method review
The resource cost method considers the benefit to the economy as a whole, including not only the direct financial benefits to the railway, but also to freight customers and the wider economy. The benefits accounted for in the resource cost method include:
- Rail linehaul net savings (for existing freight customers)
- Road linehaul net savings (for freight diverted from trucks)
- Railway operation & maintenance net savings
Interstate rail freight tonnage was based on the estimates in the Melbourne-Serviceton study, and assumed to be equal across all scenarios, with the difference in benefits related to the differences in operating costs, congestion and externalities experienced under each scenario. Starting from a base of 1.26 million tons per annum (mtpa) in 1975-76, the annual growth rate was estimated at 4% to 1985, and 3.5% thereafter. The study period was 20 years, from 1976-1995, with the Peregrine options not coming into operation until the 10th year (1985).
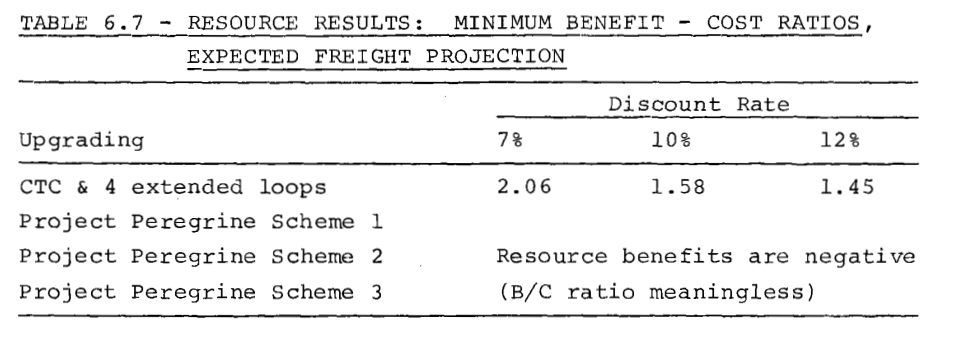
The results summary in Chapter 6 (table 6.7, reproduced above) betrays a misunderstanding of benefit cost ratios. BCRs are not provided for any of the Peregrine schemes, with the note “Resource benefits are negative (B/C ratio meaningless)”. This statement implies that the project delivers negative economic benefits, as opposed to positive benefits, but of insufficient magnitude to exceed project costs. However, it is clear that the economic benefits of the Peregrine proposal are indeed positive, as the project NPV in each case is higher (ie, less negative) than the present value of capital costs. It is therefore possible to calculate a meaningful BCR – so let’s do so.
Benefit-Cost Ratio is defined as BCR = B/C where B = present value of benefits, and C = present value of costs. Similarly, Net Present Value is defined as NPV = B – C. As NPV and BCR are known (at least for the CTC scheme) we can rearrange these two equations to solve for B and C:
Substituting the BCR and NPV figures for the CTC scheme, we see that present-value costs increase with discount rate ($2.13m @ 7%, $2.71m @ 10%, $2.69m @ 12%). This is counter-intuitive under standard financial theory, suggesting an error or non-standard method in the report. But there is another method by which we can calculate present-value costs, for both CTC and the Peregrine options.
Although present-value costs are not explicitly presented, we can easily calculate them by discounting the nominal total CapEx according to the schedule in Chapter 6 (i.e., for CTC the capital is expended in a lump sum in 1975-76, and for Peregrine in five equal amounts from 1980-81 to 1984-85). We can then find benefits by adding those capital costs to project net present value; BCR is found by dividing benefits by costs. This method yields BCRs for each Peregrine option as per the following table. The Peregrine BCRs are low, but not horrifically so; it implies that in the best case (Scheme 2), benefits would need to be slightly more than double the estimate in order to make the project viable. As we shall see, this is in fact quite plausible.
| Scheme | 7% | 10% | 12% |
| CTC | 1.88 | 1.63 | 1.49 |
| Peregrine 1 | 0.43 | 0.38 | 0.36 |
| Peregrine 2 | 0.47 | 0.41 | 0.39 |
| Peregrine 3 | 0.34 | 0.29 | 0.26 |
Extending the study period
Without delving too deeply into the methods and assumptions of the study (for which, frankly, there isn’t enough information presented to do effectively), it is nevertheless entirely appropriate to significantly extend the study period, which at 20 years including planning and construction is short to the point of being misleading. Current Australian guidelines specify a study period of 50 years for rail projects, in addition to construction period. Therefore, retaining the assumption that Peregrine begins operation in 1985, that gives us a study period ending in 2035 (this is intuitively reasonable – had Peregrine gone ahead in the 1980s, we would undoubtedly still be enjoying the economic benefits thereof now, in the 2020s).
To do this, we need to derive the annual value of benefits in each year. We know the study’s assumed freight volumes for each year, and it is reasonable to assume that the benefits are proportional to freight volume. Therefore if we can find the constant of proportionality between these two figures, we can find the annual benefits. Let’s designate this constant k; it can be interpreted as the dollar value of economic benefits per ton of rail freight carried. With the known variables B = present value of benefits, r = discount rate, F = freight volume, and t = years from project start, k is given by the following equation…
…which looks complicated, but it can be easily calculated in Excel using the NPV formula on annual freight volumes, and dividing the discounted benefits by the resultant “discounted” freight volume to find k (F is set to zero in years 1-9 for the Peregrine options, as benefits do not begin until year 10). Multiplying k by freight volume gives the annual benefit in each year, which can then be discounted to confirm the calculated NPV matches the report figure. We see that k ranges from $0.27/ton for the CTC option, to as high as $5.58/ton for Peregrine 3. The annual benefits according to this method, as well as the freight estimates, are reproduced below:
| Year | Freight (000tpa) | CTC | Scheme 1 | Scheme 2 | Scheme 3 |
| 1976 | 1,262 | 0.34 | 0 | 0 | 0 |
| 1977 | 1,312 | 0.35 | 0 | 0 | 0 |
| 1978 | 1,365 | 0.37 | 0 | 0 | 0 |
| 1979 | 1,420 | 0.38 | 0 | 0 | 0 |
| 1980 | 1,476 | 0.40 | 0 | 0 | 0 |
| 1981 | 1,535 | 0.41 | 0 | 0 | 0 |
| 1982 | 1,597 | 0.43 | 0 | 0 | 0 |
| 1983 | 1,661 | 0.44 | 0 | 0 | 0 |
| 1984 | 1,727 | 0.46 | 0 | 0 | 0 |
| 1985 | 1,796 | 0.48 | 3.24 | 4.52 | 10.03 |
| 1986 | 1,859 | 0.50 | 3.36 | 4.99 | 10.38 |
| 1987 | 1,924 | 0.51 | 3.47 | 5.17 | 10.74 |
| 1988 | 1,992 | 0.53 | 3.60 | 5.35 | 11.12 |
| 1989 | 2,061 | 0.55 | 3.72 | 5.53 | 11.51 |
| 1990 | 2,133 | 0.57 | 3.85 | 5.73 | 11.91 |
| 1991 | 2,208 | 0.69 | 3.99 | 5.93 | 12.33 |
| 1992 | 2,285 | 0.61 | 4.13 | 6.14 | 12.76 |
| 1993 | 2,365 | 0.63 | 4.27 | 6.35 | 13.21 |
| 1994 | 2,448 | 0.66 | 4.42 | 6.57 | 13.67 |
| 1995 | 2,534 | 0.68 | 4.57 | 6.80 | 14.15 |
| Present Value | 4.83 | 15.44 | 23.0 | 47.8 | |
| k ($/ton) | 0.27 | 1.81 | 2.68 | 5.58 |
These figures appear reasonable for CTC and Schemes 1 and 2, but admittedly fairly optimistic for Scheme 3. Rail haulage costs in 1976 were around $12.50/ton for Adelaide-Melbourne rail freight (the study estimates 1.57c per net-ton-km), meaning that Peregrine 3’s net benefits amount to nearly half the total operating costs on the line. Looking at it another way, Peregrine 3’s benefits are over double those of Peregrine 2. This appears implausible given that the only operational difference between Schemes 2 and 3 is a slight reduction in ruling gradient (from 1:45 to 1:80) for eastbound trains only, and that would be ignoring any operational costs imposed by the very long tunnel. Still, this is the level of benefit that is implicitly assumed by the BTE study.
Having calculated k, and thus the nominal value of benefits in each year, we can now extend the study period. Retaining the same 3.5% freight growth rate after 1995 undershoots what we now know were the freight numbers in those decades (it predicts 4.0mtpa in 2008, vs the actual figure of 4.8mtpa). If we instead use 5.0% growth, we more closely match the rapid growth in freight task that was observed between 1995-2010, even without any major upgrade of the railway. Using this assumption (and reverting to the more conservative 3.5% after 2010) we repeat the calculation in each year out to 2035, at which time the predicted freight volume reaches 10.8mtpa (approximately the capacity of the unmodified railway). We see that the BCRs for Schemes 1 and 2 both exceed marginal viability at the 7% discount rate, while Scheme 3 still falls short even with its (arguably) very optimistic assumptions.
| CTC only (no track) | Peregrine 1 (easings) | Peregrine 2 (deviations) | Peregrine 3 (long tunnel) | |
| Travel Time ADL-MTO | 2:07 | 1:30 | 1:15 | 1:00 |
| Capital Cost (nominal, 1976) | $2.75m | $61.2m | $84.0m | $237.6m |
| Capital Cost (discounted @7%) | $2.57m | $35.8m | $49.1m | $138.9m |
| Years construction | 1 | 5 | 5 | 5 |
| Introduction year | 1 (1976) | 10 (1985) | 10 (1985) | 10 (1985) |
| Resource Cost NPV (20 years) | $2.26m | -$20.3m | -$26.2m | -$91.2m |
| Benefits (20 years) | $4.83m | $15.44m | $22.96m | $47.76m |
| Benefits (50 years) | $8.22m | $38.3m | $57.0m | $118.5m |
| BCR (20 years) | 1.88 | 0.43 | 0.47 | 0.34 |
| BCR (50 years) | 3.20 | 1.07 | 1.16 | 0.85 |
Monarto Benefits
In an appendix, the BTE acknowledged the potential economic benefits of a fast rail service to the proposed Monarto development, but defined this narrowly to include only travel time savings accruing to commuters on Mount Barker Road. They estimated that from Peregrine’s introduction in 1985, this benefit would grow to $3.6 million per year by 2005, the whole benefit stream having a present value of $11.5m. We can extend this out to a 50-year study period by adding the present value (in 1976) of an annual benefit of $3.6m from 2006 to 2035; this increases the total benefit from $11.5m to $17.4m.
This benefit was for Peregrine Scheme 3, the “Long Tunnel”. It would appear reasonable, based on proportional travel time savings, to assume that Scheme 1 would achieve 50% of this benefit, and Scheme 2, 75% ($7.95m and $13.0m, respectively). Contra the conclusion in the report, adding these passenger benefits would have made a material difference to the BCR of each project, as shown in the table below. Schemes 1 and 2 are no longer marginal, while Scheme 3 falls very slightly short of viability. This result is conservative, as it takes no account of avoided passenger vehicle operating costs, crash costs or other externalities, and even the time value is arguably underestimated – the assumed value of $1/hr is only 20% of the 1976 average wage (40% is the generally accepted method).
| Peregrine 1 | Peregrine 2 | Peregrine 3 | |
| Costs | $35.8m | $49.1m | $138.9m |
| 50-y Benefits (without pax) | $38.3m | $57.0m | $118.5m |
| 50y Benefits (with pax) | $45.9m | $69.4m | $135.0m |
| BCR (with pax) | 1.28 | 1.41 | 0.97 |
Note that this completely different verdict is the result of using the exact same assumptions and data as the original study, but simply evaluated over a longer timeline. There can be no reasonable objection to the criticism that evaluating just 11 years of operation takes an improperly short-term view of long-term infrastructure investment.
While this is technically a win for Peregrine, such arguments are merely academic. The 1970s are now in the fairly distant past, effectively irrelevant from a modern economic point of view. We have already noted the likely overestimate of benefits for “Peregrine 3”, as well as a possible error in calculating BCR, which may mean the report’s NPVs, and therefore our reconstruction of annual benefits, are also inaccurate. And of course, the Monarto development did not go ahead as then planned. The report was likely correct in its conclusion that the Peregrine proposals were not justified within the following twenty years: freight volumes, for both rail and road, would take some time to grow to the point where a Peregrine-style intervention was justified in the near term. The BTE therefore foreshadowed a revisitation of the question in the 1990s, when freight volumes would have grown substantially. This was in fact very nearly what happened.
The 2001 Interstate Network Audit
Despite the negative findings of the 1977 evaluation, Peregrine stayed on the backburner for decades, surviving the 1978 reorganisation of the South Australian Railways into Australian National, and much later into the Australian Rail Track Corporation (ARTC) in 1998. One of the early major reports by ARTC was the Interstate Rail Network Audit, completed in 2001, where a modified version of Peregrine was adopted as an aspirational goal for the Adelaide-Melbourne railway. Thus Peregrine was subject to its second major evaluation, but now with recognisably contemporary market assumptions. All costs for this section are expressed in 2001 dollars.
The audit identified enhancements required to bring the ARTC network into line with performance guidelines developed by the Australian Transport Council in 1997. Each major intercapital segment of the network was considered as a separate project. For each segment, performance characteristics were identified corresponding to the minimum market requirements (dubbed “Secenario 1” or S1), and a more ambitious set of “stretch targets” (“Scenario 2” or S2). For Adelaide-Melbourne, these were:
Scenario 1 (“minimum market requirements”)
- 115km/h maximum and 80km/h average speeds at 21TAL
- Train lengths of 1800m.
- Transit time reduced to 12.0 hrs from the base-case of 13.0 hrs
- Freight volume increased 17% from the base case
- Market share increased from 21% to 24%
Scenario 2 (“stretch targets”)
As above, but also:
- Structures modified to allow double-stacking clearance
- Transit time reduced to 9.0 hours
- Freight volume increased 42% from base case
- Market share increased from 21% to 28%
Meeting the S1 targets on the ADL-MEL corridor would require interventions somewhat less ambitious than Peregrine Scheme 1 (mostly concerning centralised control and crossing loops), while S2 would require interventions roughly equivalent to Peregrine Scheme 3. Ultimately, and not without a certain parodic flair, ARTC adopted what they termed “Scenario 0” – the so-called “optimised” scenario, in which overall NPV was maximised within the limited budget available. In fairness, S0 was a fairly decent package of works – generally slightly better than S1. However it did favour projects on the more heavily-trafficked eastern states corridors, and therefore none of the Peregrine-derived options were selected for construction.
Scenario Detail
The proposed deviations and other treatments are discussed in detail in Appendix D – Operational and Engineering Cost Estimates, and Operational and Engineering Studies – East/West Corridor; these appendices include a large list of potential projects that could be combined to deliver the required performance benchmarks of S1 and S2. The individual projects adopted for each scenario were selected according to the lowest cost per minute saved. Unfortunately, in prioritising projects in this manner, a number of redundant or otherwise inappropriate projects were selected. The S2 projects chosen for Adelaide-Melbourne totaled $810m ($1.47bn in 2023 dollars) and included:
- Reopening the Sunshine-Ballarat-Ararat route (which would bypass Newport and Geelong)
- Deviations at both Newport and Geelong, as well as rerailing the rest of the Newport-Geelong-Ararat route
- The 1500m loops of S1 are added to the 1800m loops of S2 (the time saving is also double-counted)
- Loops between Spencer Junction and Tarcoola are included in Melbourne-Adelaide, instead of Melbourne-Perth.
- The double stacking structure clearance cost applicable to the “with tunnel” scenario is selected (presumably because it’s cheaper) without also selecting the tunnel (presumably because it’s expensive)
While this results in an impressively low cost per minute saved (at least on paper), those savings are not realisable in any practical sense. There may or may not be a case for upgrading both the Geelong and Ballarat routes, but the time savings from one will not stack with the other! Certainly, there is no justification for including Adelaide-Perth works, and if the existing Adelaide Hills tunnels are not bypassed, then they will need to be included in clearance improvement works, at an extra cost (according to the study) of some $30m.
There is a further problem with the treatment of train management and rollingstock improvement initiatives. The individual projects within these categories have been allocated to different corridors, apparently arbitrarily, with the costs and benefits of the project confined to that corridor. This is a highly inappropriate methodology, resulting in some corridors such as ADL-MEL bearing an outsize burden of the costs of these common projects, while receiving only part of the benefits. Essentially the ADL-MEL corridor is “subsidising” the preferred East Coast corridors. The reality is that these network-wide projects would deliver their benefits largely equally across all corridors, and the cost should therefore be allocated proportionally by each corridor’s share of the freight task (Adelaide-Melbourne is just 16%, or 34% if MEL-PER traffic is included)
While the ARTC’s S2 suite of projects would not actually combine to deliver the S2 requirements, we can easily devise an alternative suite that still achieves in excess of 4hrs time saved, well within the same budget of $810m (in fact, for almost $50m less). Our modified S2 projects end up comprising the following, which is essentially a combination of the tunnel from Peregrine 3 and the curve easings from Peregrine 1, plus some additional deviations in Victoria, passing loops and other efficiency measures:
| ADL-MEL S2 Projects | Cost ($m) | Time saving (min) | $m/min |
| DEVIATIONS | |||
| Newport | $60.4 | 9.4 | $6.4 |
| Geelong | $49.8 | 10.2 | $4.9 |
| Horsham | $30.2 | 12 | $2.5 |
| Rocky Gully | $10.0 | 1 | $10.0 |
| Warla Bank | $11.6 | 2 | $5.8 |
| Kanmantoo | $4.5 | 2 | $2.2 |
| Blakiston | $8.6 | 2 | $4.3 |
| Mt. Barker Junction | $2.1 | 2 | $1.1 |
| Balhannah | $4.0 | 2 | $2.0 |
| Lynton-Verdun Tunnel | $321.8 | 30 | $10.7 |
| TRACK IMPROVEMENT | |||
| Speed restrictions (Adelaide Metro) | $1.0 | 5 | $0.2 |
| Curve speeds (Newport-Ararat) | $7.7 | 16 | $0.48 |
| Curve speeds (Ararat-Murray Bridge) | $21.0 | 11 | $1.91 |
| Re-railing 60kg (Vite Vite-Geelong) | $20.9 | 10 | $2.09 |
| Re-railing 60kg (Monteith-VIC border) | $32.8 | 10 | $3.28 |
| TRAIN INTERACTION | |||
| 1,800m loops | $31.6 | 10.6 | $3.0 |
| OPERATIONS (MEL-ADL-PER share) | |||
| Managment | $9.1 | 95 | $0.1 |
| Rollingstock | $52.8 | 40 | $1.32 |
| CLEARANCE | |||
| Double-stacking works (with tunnel) | $83.8 | ||
| TOTAL | $764 | 270 | $2.83 |
Economic Evaluation
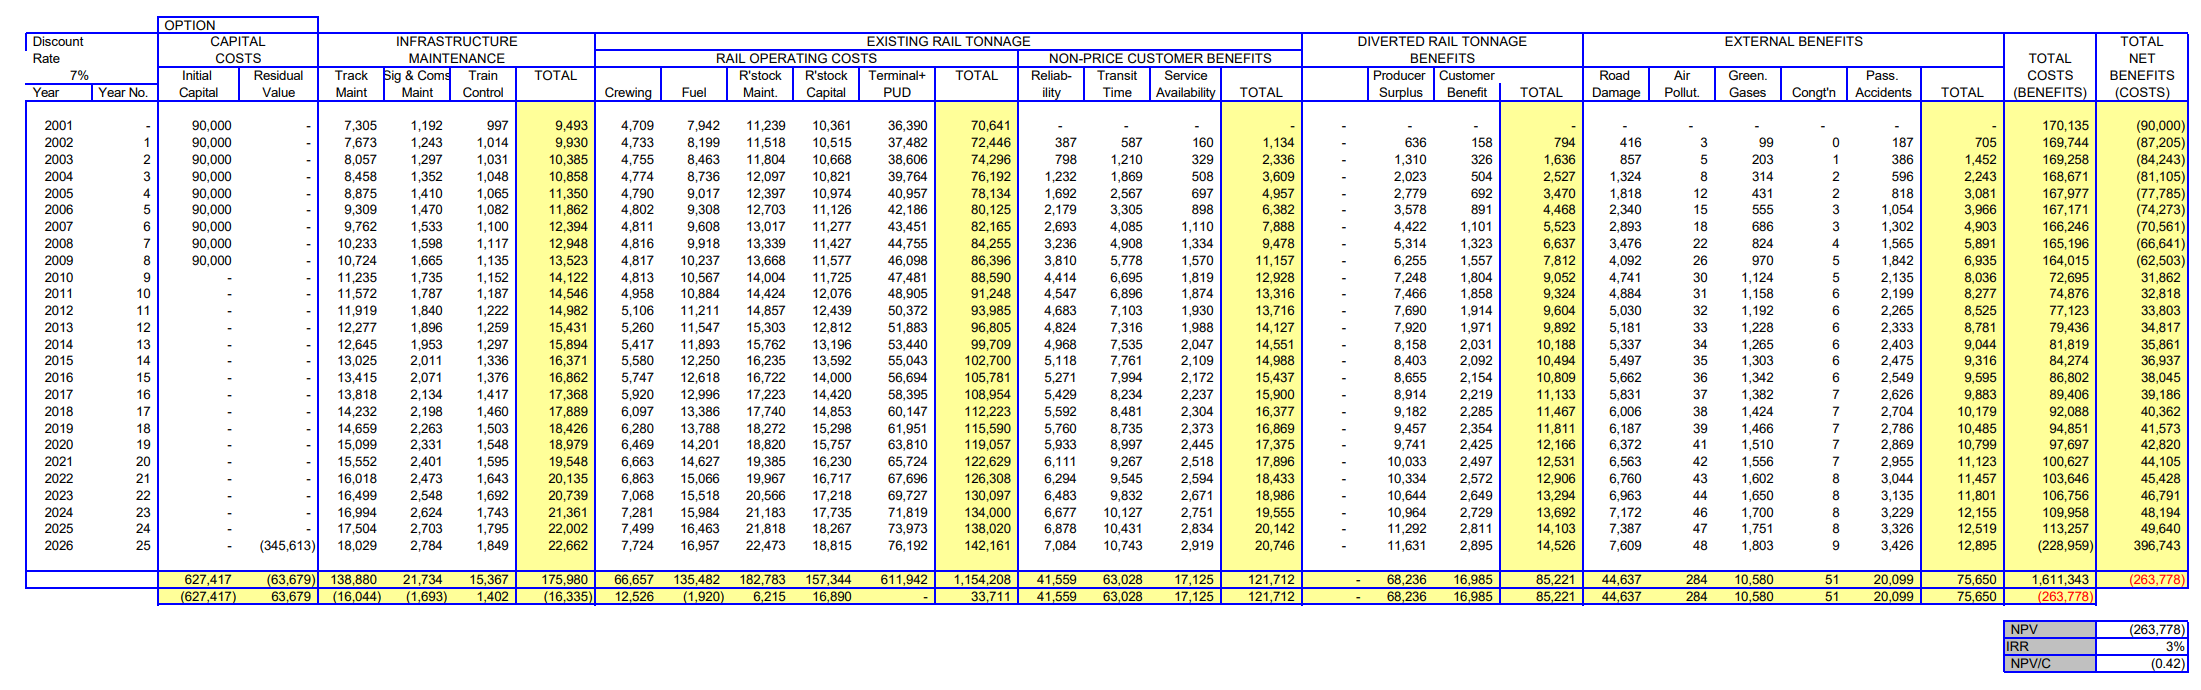
The Network Audit’s economic evaluation was performed over a 25-year study period. Appendix E (Evaluation Results) shows the full cost and benefit stream for each scenario and corridor, annually out to 2026. Full credit where it is due – this level of “showing your work” needs to be encouraged in economic evaluations. This is the minimum level of detail required for a reader to properly understand how a study has arrived at its conclusions.
We won’t quibble with the magnitude of the estimated benefits. The vast majority of the study’s estimated benefits come from either non-price benefits to existing freight (time savings, reliability), or rail tonnage diverted from road (OpEx savings and externality reduction). Without going into the details, these appear reasonable (though one could make an argument that the direct operating cost benefits accruing to existing freight have been underestimated). We do find, however, that there is a fundamental error in the study’s treatment of the separate corridors that makes a material difference to the economic viability of each option.
Divided they fall
Let’s first take a look at the freight volumes in the base case estimates. We see that in the base year (2001), the study estimates direct operating costs at $70.6 million. Dividing this by the Adelaide-Melbourne rail freight unit cost of $45/ton gives us a freight volume of 1.57mtpa – slightly higher than the actual volume of Adelaide-Melbourne freight in the year 2000 (see pp.28 of the Final Report). But the Adelaide-Melbourne railway doesn’t only carry Adelaide-Melbourne freight – it also carries Melbourne-Perth. The actual total freight volume carried on the Adelaide-Melbourne Railway in 2001 exceeded 3.4mtpa. The study has therefore ignored almost half the actual traffic on the line – and therefore half the benefits of upgrading this corridor!
Meanwhile, the Melbourne-Perth corridor is similarly treated as an entirely separate project with a separate set of interventions (many of which are actually the same as the Melbourne-Adelaide interventions – see pp.26-27 of Appendix D). In this corridor, we see direct operating costs in the base year of $174.6 million; dividing this by the MEL-PER unit cost of $113/ton gives 1.55mtpa – exactly the figure given for Melbourne-Perth freight in 2000, which in turn means that Sydney-Perth freight has also been excluded here.
This is not an appropriate way to evaluate benefits on different corridors. The confusion seems to stem from the treatment of corridors as origin-destination city pairs, rather than as segments of track. An evaluation of the “Adelaide-Melbourne corridor” is not just for “Adelaide-Melbourne freight” – it should consider all of the freight that runs upon it, including that ultimately bound for Perth or elsewhere. Meanwhile, what this study has treated as the “Melbourne-Perth” corridor should instead be considered an “Adelaide-Perth” corridor, with incremental benefits on top of works performed in other corridors like Melbourne-Adelaide, or Parkes-Crystal Brook.
A cursory look at the rest of Appendix E confirms that the same error has been committed for the North/South corridor (ie, treating the MEL-SYD, SYD-BNE and MEL-BNE city-pairs as isolated projects, despite the benefits of one project being shared among others). This is a fundamental scoping error with the Interstate Network Audit, which is one of the most influential documents in Australian rail (it was used, for example, as a rationale for the Inland Rail project, which became ARTC’s main infrastructure priority and has absorbed the lion’s share of interstate rail’s budget and advocacy for over 20 years). This error could possibly be responsible for a grave misallocation of national resources, and is worthy of a more detailed investigation. But the focus of this article is on Project Peregrine, and therefore we’ll leave our discussion of the wider report, and its implications for the Australian rail industry, for another time.
Combined Project: Melbourne-Adelaide-Perth
We’ve demonstrated that the original report was effectively double-counting costs, and half-counting benefits. No wonder the economic evaluation looked so poor. But it’s a relatively simple matter to fix, by combining Adelaide-Melbourne and Melbourne-Perth into a single project. This is easily achieved by adding the Appendix E year-by-year summary tables for MEL-ADL and MEL-PER together. But first we have to modify the Melbourne-Perth capital expenditure to eliminate double-counting of the Melbourne-Adelaide projects.
Modified MEL-PER S2 Projects
On top of the Adelaide-Melbourne S2 projects (which we’ll conservatively assume at the original $810m cost and 4-hour time saving), the Melbourne-Perth corridor needs only a further 2-hour saving in order to meet its own S2 travel time criterion (i.e., a 6-hour saving from the base case). This, as well as double stacking, could be achieved with the following set of works (selected from those in Appendix D, pp.27):
| MEL-PER S2 Projects | Cost ($m) | Time saving (min) | $m/min |
| ADL-MEL project suite | $810 | 240 | $3.38 |
| TRACK IMPROVEMENT | |||
| Curve Speeds (Adelaide to Avon) | $130 | 58 | $2.24 |
| Track Structure (Perth-Kalgoorlie) | $22.0 | 10 | $2.2 |
| Speed restrictions (Perth-Kalgoorlie) | $5.0 | 18 | $0.28 |
| Speed restrictions (Kalgoorlie-Coonamia) | $7.0 | 30 | $0.23 |
| TRAIN INTERACTION | |||
| 30min/1800m loops | $28.0 | 10 | $2.8 |
| CLEARANCE | |||
| Double-stacking works (Adelaide-Perth) | $10.1 | 0 | N/A |
| TOTAL | $1,012 | 366 | $2.77 |
| TOTAL (ADL-PER works only) | $202 | 126 | $1.60 |
Now we can add the costs and benefits for each individual segment and observe the results in the following table and chart (all dollar figures discounted to 2001 AUD at 7% discount rate). It is also simple to extend the study period; we conservatively assume no further change of either costs or benefits after 2026, and extend the study period to 2059 (being 50 years after completion of construction).
| S2 Scenario | Costs $m | Benefits $m | NPV $m | BCR | IRR |
| MEL-ADL (original) | 643.7 | 380.0 | -263.8 | 0.59 | 2.35% |
| MEL-PER (original) | 518.9 | 516.6 | -2.3 | 1.00 | 6.95% |
| MEL-PER (modified) | 190.5 | 483.2 | 292.7 | 2.54 | 22.2% |
| MEL-ADL-PER (25 years) | 834.3 | 863.2 | 28.9 | 1.03 | 7.36% |
| MEL-ADL-PER (50 years) | 854.4 | 1,097.5 | 243.1 | 1.28 | 8.93% |
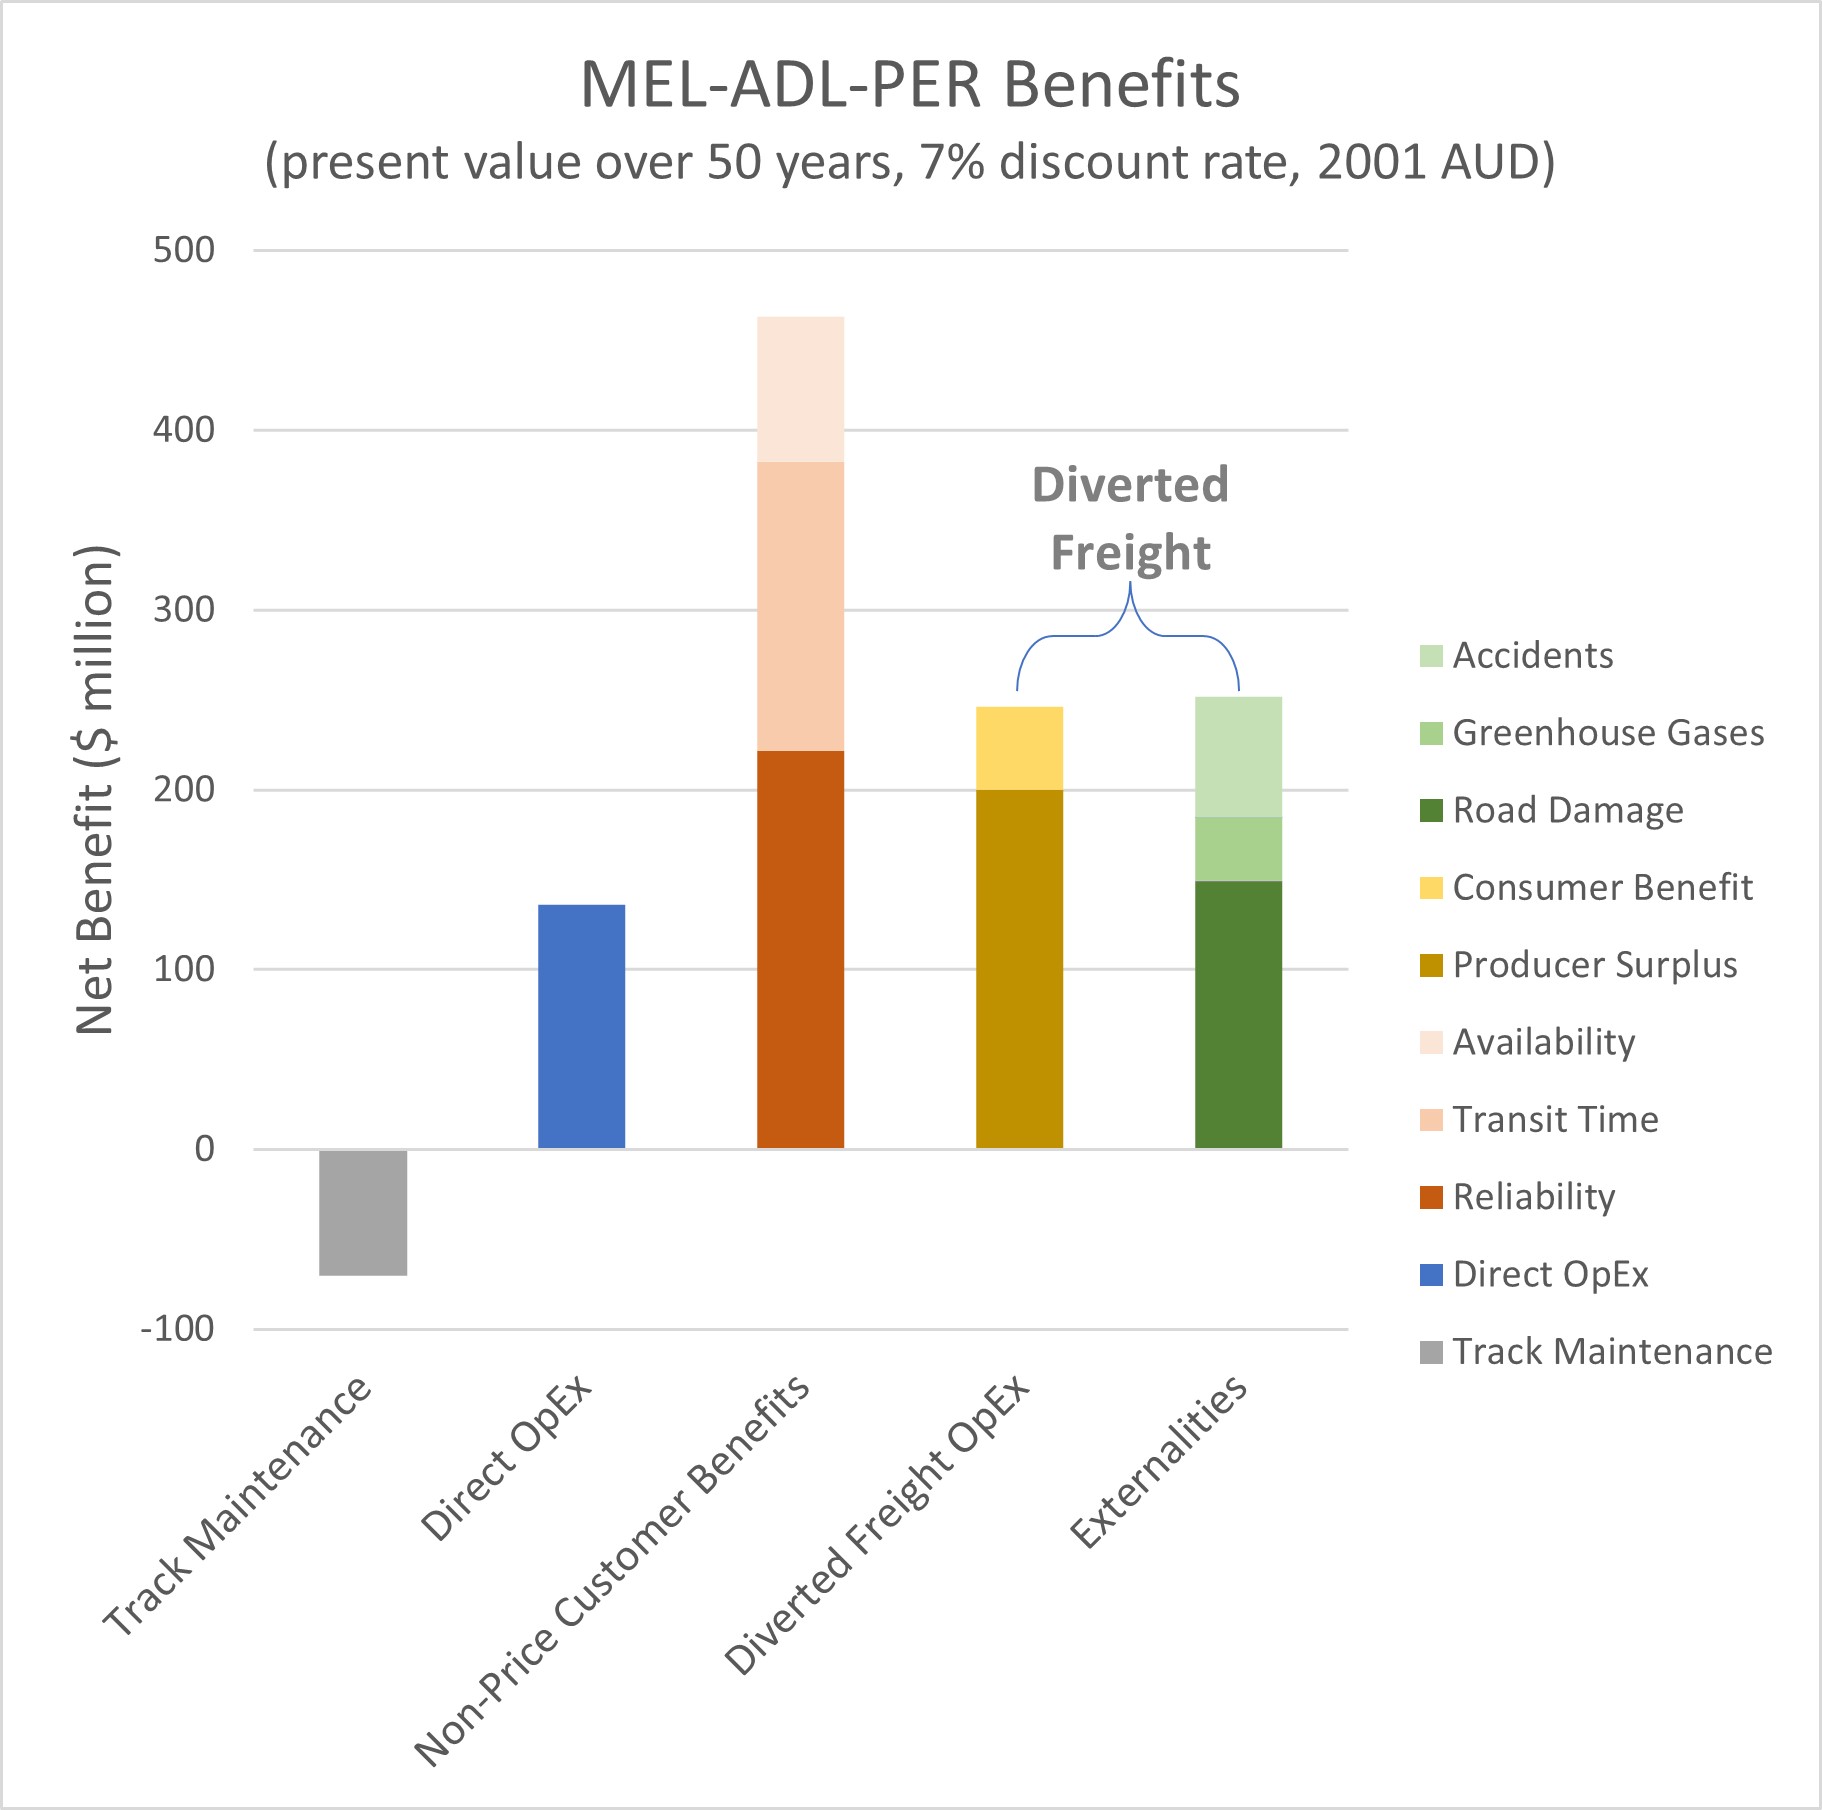
It is clearly evident that if the Interstate Network Audit had properly distributed benefits between its various corridors, the Melbourne-Adelaide-Perth corridor would have been viable at the 7% discount rate, even using the original 25-year study period, but clearly so on a 50-year horizon. Furthermore, the vast majority of those benefits would have been attributable to the Melbourne-Adelaide S2 project suite – probably 80%+ if we allocate benefits proportionally to time saved, given that all of the MEL-ADL and two thirds of the MEL-PER time savings would be realised in that corridor. Under those assumptions, the MEL-ADL S2 projects would deliver $878m of present value benefits, for a present-value capital expenditure of $644m, resulting in a BCR of 1.36 – very close to the estimate we made by extrapolating the BTE’s 1977 evaluation.
Chalk up another win for Peregrine.
The Adelaide Rail Freight Movements Study (2010)
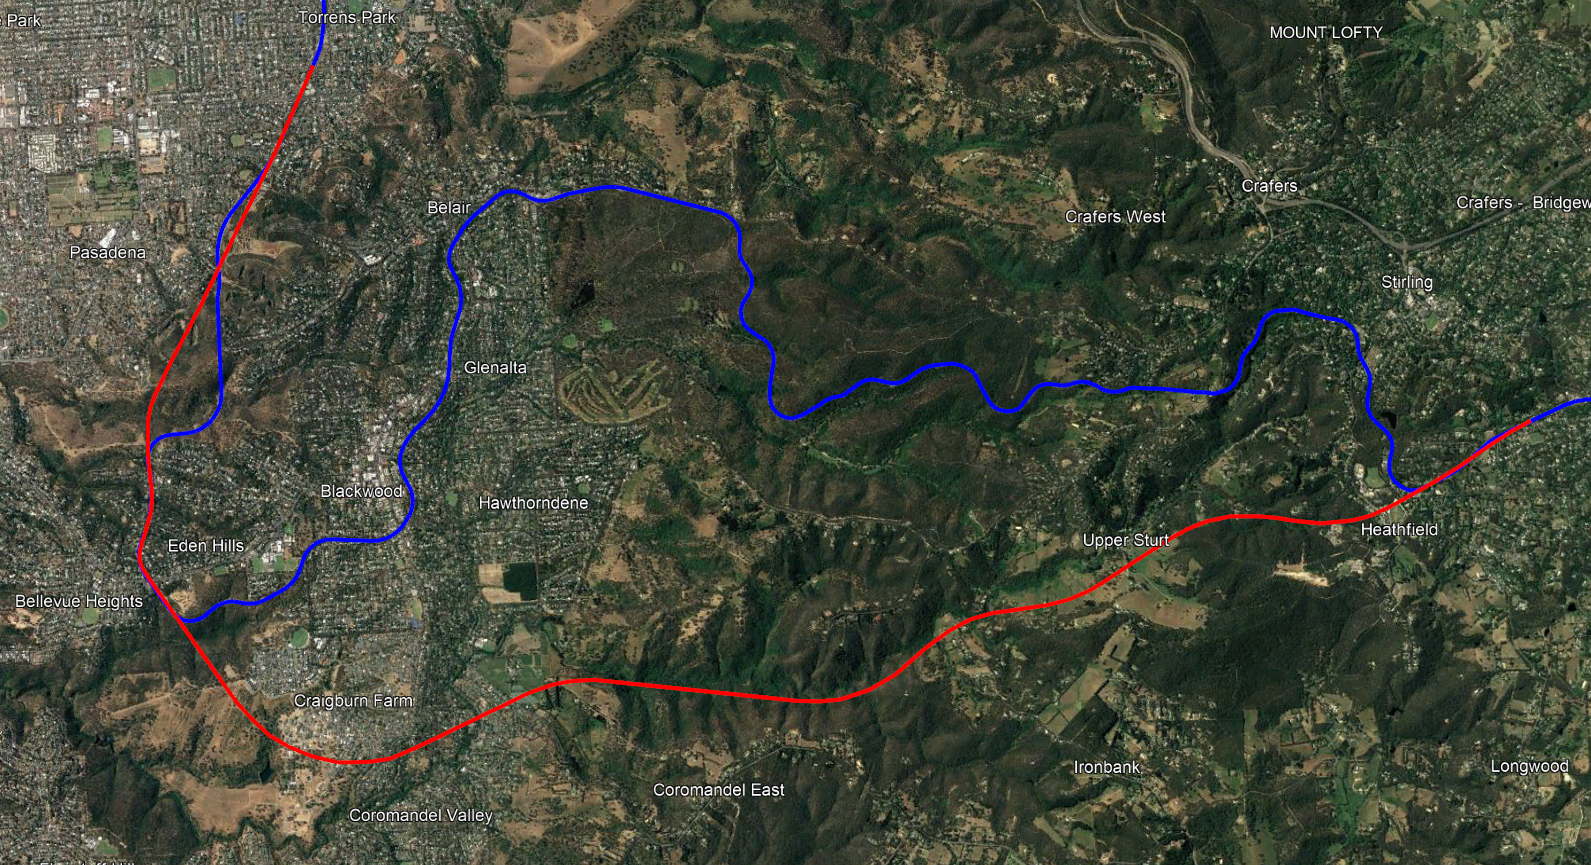
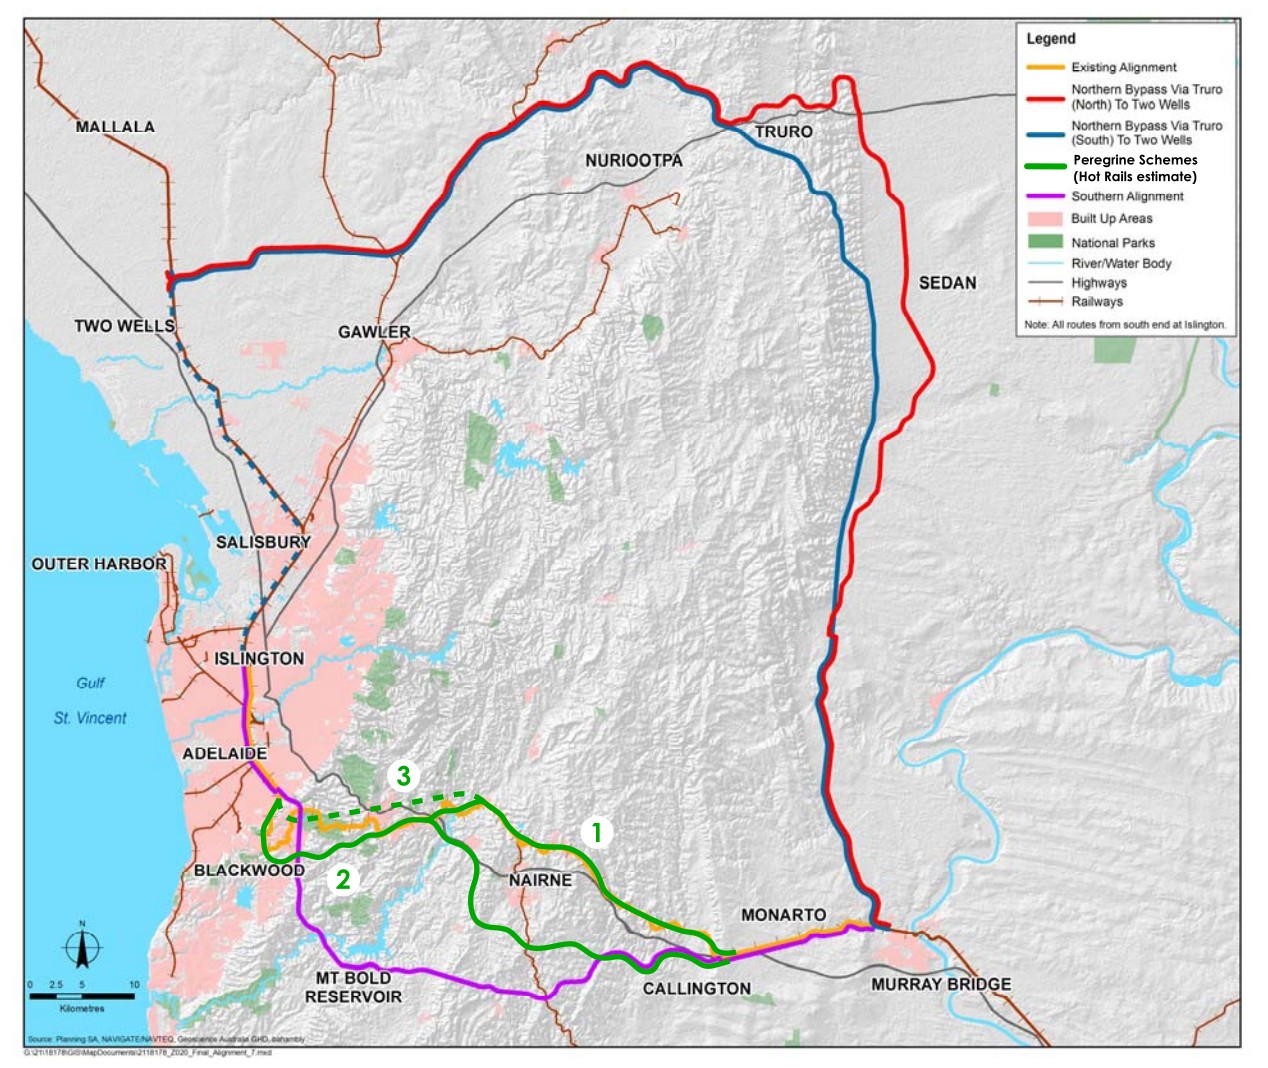
The most recent major study into the Adelaide Hills railway was the Adelaide Rail Freight Movements Study (ARFMS) of 2010. This study had two main differences in scope to the other studies we’ve looked at – first, the removal of rail freight from residential areas, particularly in the Adelaide Hills, was a primary design goal, and secondly, a 1% maximum gradient was treated as an absolute, rather than merely desirable specification. As a result, the ARFMS alignment concepts are far more ambitious than any of the Peregrine options – not only do they require at least as much tunneling, bridges and heavy earthworks, but they are also much longer (this can be clearly seen in the comparative map below). The ARFMS presented five options:
- Upgrade Existing – clearance works for double-stacking, plus some grade separations and noise attenuation walls. Estimate: $700m ($975m in 2023 dollars)
- Northern Bypass (north of Truro) – 170km of new or reinstated track, bypassing Adelaide entirely via the Sedan Railway and the Barossa Valley. Estimate: $2.9bn ($4.0bn in 2023)
- Northern Bypass (south of Truro) – A similar but slightly shorter route compared to the above, beginning its ascent of the range further to the south. Estimate: $2.4bn ($3.3bn in 2023)
- Southern Alignment (via Mount Bold) – A completely new alignment through the southern Adelaide Hills, requiring extensive structures including a very long tunnel (15km+). Estimate: $3.0bn ($4.2bn in 2023)
- Combined Upgrade and Bypass – A combination of upgrading the existing railway, and the “south of Truro” bypass, to give maximum benefit to through-freight without disadvantaging Adelaide-bound freight. Estimate: $3.2bn ($4.5bn in 2023)
We published an extensive review of this study earlier this year, which revealed some severe deficiencies in the ARFMS’s method – most notably, confining the study to just the area between Murray Bridge and Two Wells and therefore ignoring the benefits of running longer, double-stacked trains for the rest of the distance between Melbourne and Perth, but also neglecting to consider any diverted or induced freight, and having an inappropriately short evaluation period. All of this combined to significantly depress the study’s estimated benefits. The cost estimates however appear reasonable considering the engineering works entailed, in line with other contemporary estimates.
The changes we proposed to the ARFMS went far beyond what we’ve done for the other studies in this article, so we will not go into detail here. We concluded, however, that with our proposed modifications, all the proposed options would have been strongly viable, with the “Southern Alignment” via Mount Bold (the option most comparable to Peregrine) resulting in by far the greatest net present value:
| BCR | NPV | |
| Upgrade Existing | 5.16 | $2.5bn |
| Northern Bypass | 2.06 | $2.1bn |
| Southern Alignment | 2.59 | $3.8bn |
We include this brief overview only to show the ARFMS proposals in the context of the earlier Peregrine schemes. The ARFMS alignment options would require – by far – the most significant engineering works of any upgrade to the Adelaide Hills railway proposed over the last 50 years, including the Peregrine 3 “Long Tunnel” scheme. Rail industry submissions to the ARFMS were almost unanimous in wanting the study to consider additional options for upgrading the existing railway, rather than a completely new route. We believe that the time has come for such options to be given proper consideration.
Is it time to revisit Peregrine?
The two major economic evaluations of Peregrine both used a short study period, compounded by including a long construction period within that already short timeframe. By simply extending the study forecasts to meet the Australian standard of 50 years plus construction, and using the most conservative assumptions for this extra period, both the Mainline Upgrade study of 1977 and the Interstate Network Audit of 2001 in fact comfortably show Peregrine to be economically justified, each demonstrating a benefit-cost ratio of approximately 1.4 at a 7% discount rate. Using the more optimistic method we employed in our review of the 2010 Adelaide Rail Freight Movements Study, the BCR of a Peregrine-style upgrade would be as high as 2.6 or even more.
Certainly, a valid criticism of the approach taken in this review is that infrastructure costs in Australia over the last 20 years have generally escalated at a rate far exceeding CPI. If Peregrine were subject to a rigorous cost-benefit analysis under today’s conditions, costs would likely be higher than in those earlier studies. But then, of course, so too would the benefits. And in fact, the potential benefits are far higher than they’ve ever been – by a long way.
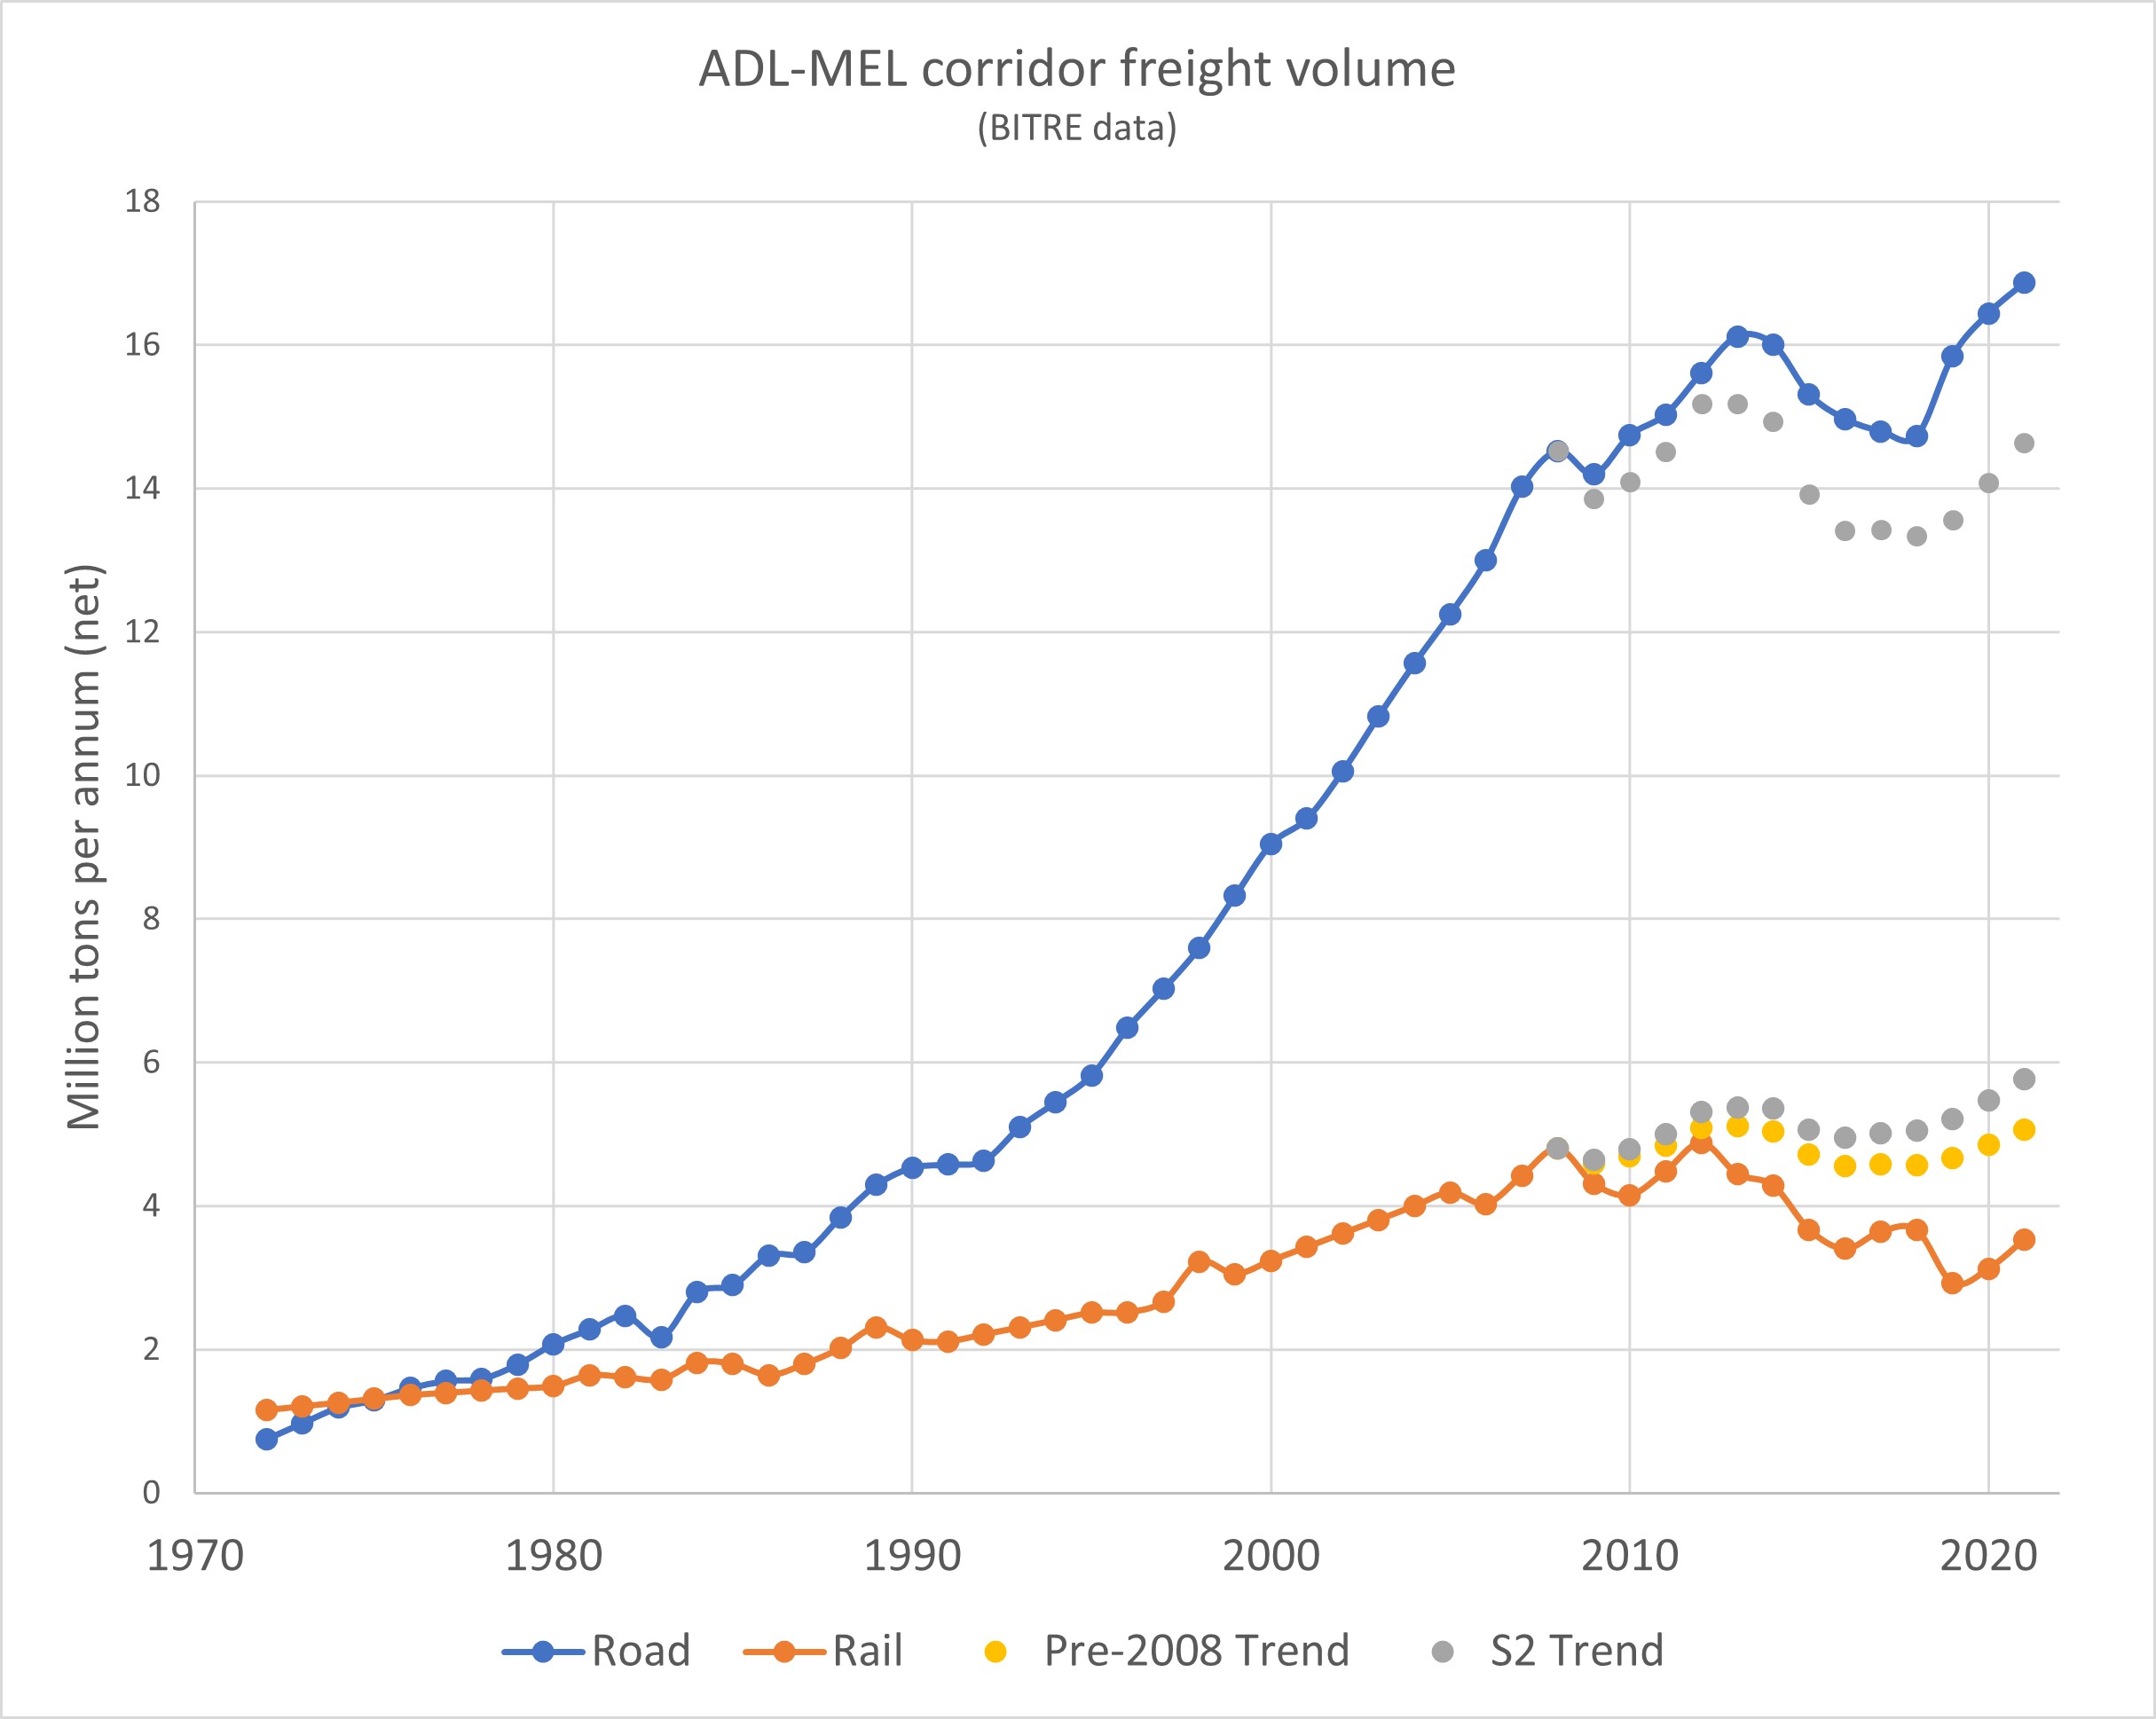
Actual freight tonnages in the years since the studies have closely matched their forecasts – to 1995 in the case of the Mainline Upgrade study, and 2008 for the Network Audit – despite no major upgrade having gone ahead. However since 2008, and especially from 2012, a substantial improvement in interstate road freight productivity has eroded rail’s relative market share, though in absolute terms the Adelaide-Melbourne corridor still carries the same tonnage as it did in 2000. This suggests that if Peregrine were revisited now, in the mid 2020s, the benefits from diverted freight would be much larger. If we assume the rail upgrade would return market share to its pre-2008 trend (~24%), this would divert 1.7mtpa from trucks, growing at 2-4% per year. If such an upgrade achieved the S2 target of 28%, it would divert 2.4mtpa – nearly a doubling of current volumes! Even then, this would represent only a small percentage of truck volume, which would maintain a positive overall growth rate.
In contrast, the 2001 ARTC study expected a market capture in S2 of only 504,000 tons per annum on the combined ADL-MEL-PER corridor, with about 80% of that on the ADL-MEL section (see the figures in Appendix C, pp.38). It is therefore reasonable to estimate that the benefits of diverted freight would be at least 3-5x higher in a current evaluation, which would increase present-value benefits to $5.4 billion in 2023 dollars – not including any passenger benefits! That’s a pretty big margin for cost escalation – the 2001 Network Audit’s $810m estimate comes to $1.45bn in 2023 dollars – even if costs had escalated by a factor of 4 over and above inflation (probably a reasonable estimate, to be brutally frank), Peregrine would still be marginally viable.
Any honest look at the data leads to one conclusion: a modern version of Peregrine would be likely to deliver tremendous economic, social and environmental benefits – perhaps more so than any other contemporary infrastructure project in Australia. The benefits would not be in some far-off and uncertain future, dependent on decades of economic growth to realise. Rather, they would be realised almost immediately upon completion of construction. Moreover, the rising cost of energy, and increasing adoption of low-emissions standards further improves the advantage that a modernised rail network would enjoy. At the very least, Peregrine demands attention in our national conversation.
The Adelaide Hills railway has been in the “too hard” basket for a long time, but it is becoming clear that the reward would be worth the difficulty. Over just the last 10 years, the competitive misalignment between road and rail has reached unprecedented levels. The more extreme the market distortion, the greater the potential benefit in resolving that distortion, which presents an historic opportunity for our times. Far from being a curiosity of a bygone era, Project Peregrine is an idea whose time has come.
The only way we will see any meaningful improvement to the Adelaide -Melbourne rail line, particularly from Tailem Bend to Dry Creek is for ARTC to exit and hand over the rail to a more progressive rail consortium, which will focus on improving rail track alignment, rail freight volume, gaining back the loss of freight volume from road to rail.
The rail consortium can consist of a PPP arrangement or consortium fully funded and controlled.